The Toolbar
The Toolbar
The toolbar appears at the top of the Settings screen and at the top of the Acquisition, Analysis, and
Publish tabs in the workspace. The toolbar consists of various sections, depending on the context in
which it appears.
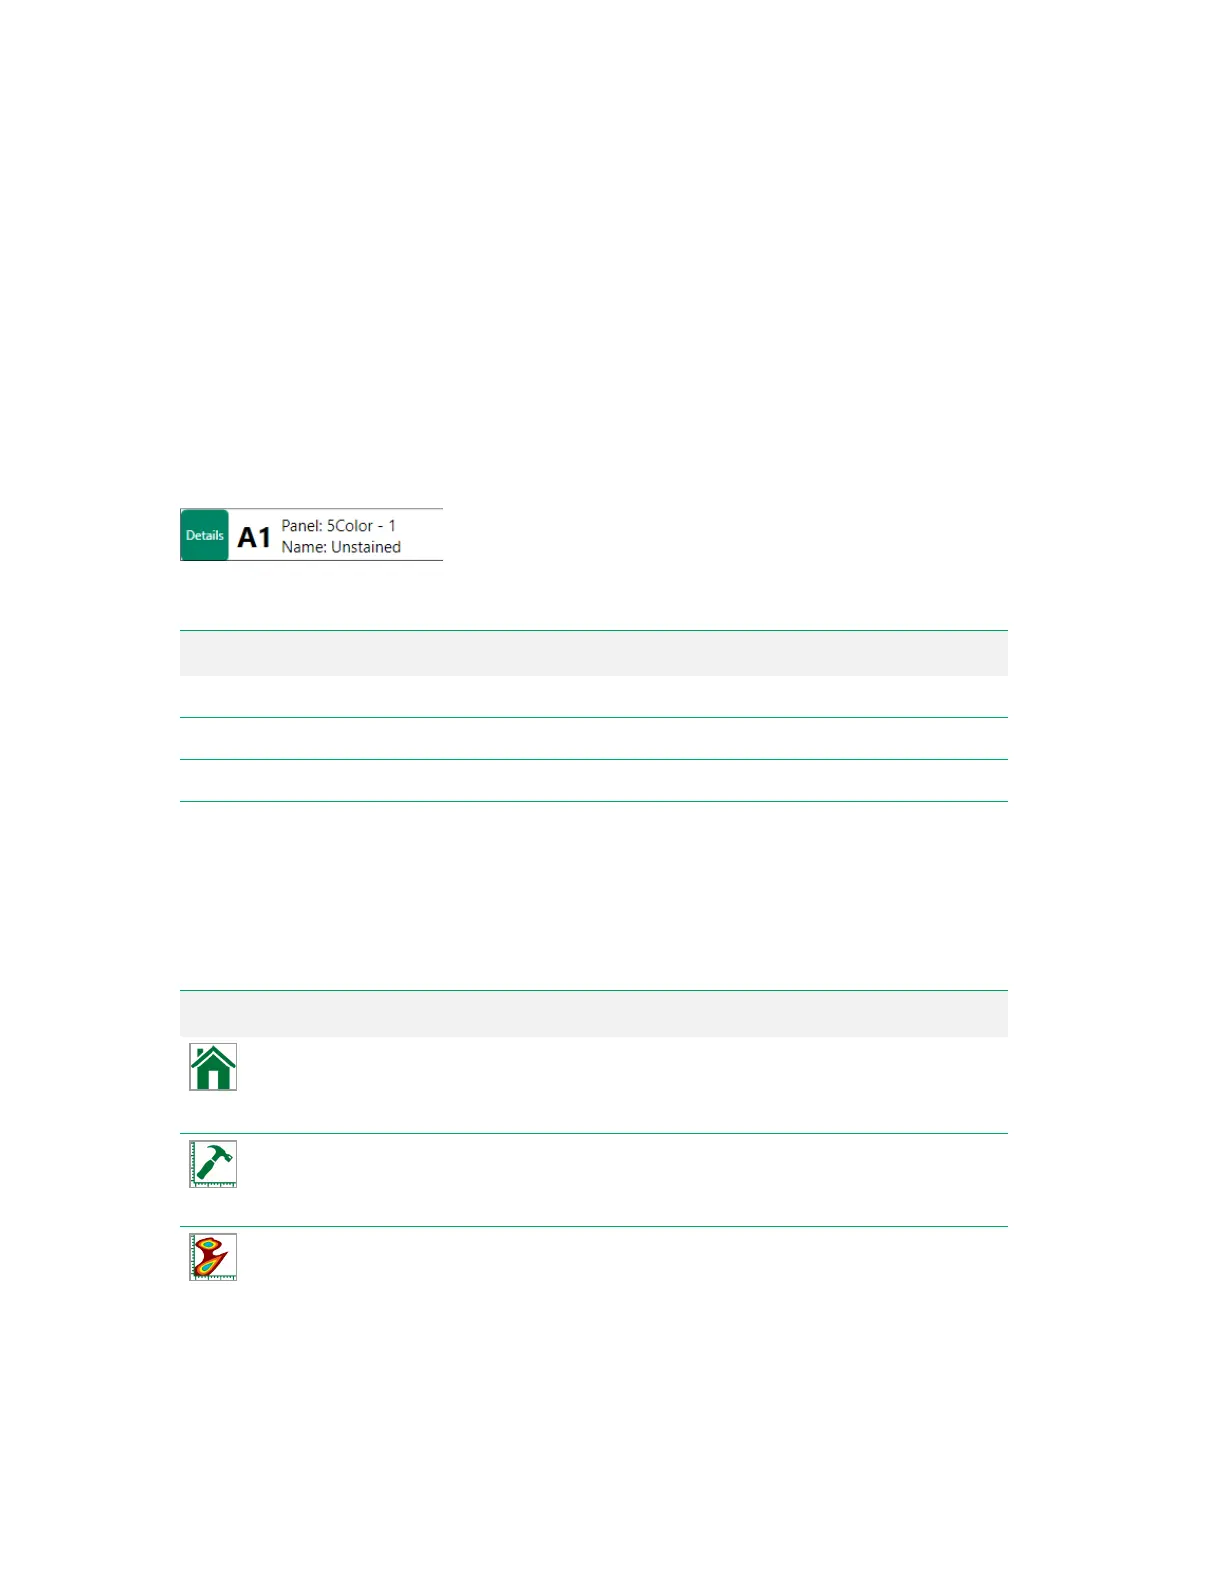
Details
Details appear in the toolbar of the Settings screen.
Item Function
A1
The position currently selected in the plate map.
Panel
The name of the experimental panel to which the selected position belongs.
Name
The sample name for the selected position.
Table 24. Details toolbar items and their functions
Tools
The following tools appear in both the Settings screen toolbar and the Acquisition tab toolbar unless
otherwise noted.
Button Function
Home
— returns you to the Home window, where you can create a new experiment or
open one that has already been created.
Note: This tool appears only in the Acquisition workspace toolbar.
Advanced Plot Builder
— facilitates creation of histograms for all parameters, with
constraints that you define. For more information, see Creating Histograms for All
Channels on page 214.
Create Density Plot
— creates a bivariate (two-parameter) density plot. For more
information, see Creating Density Plots on page 211.
Table 25. Tools buttons and their functions
User Guide | 93