Chapter 7 Creating Experiments and Workspaces
Adding Bar Regions to Histograms
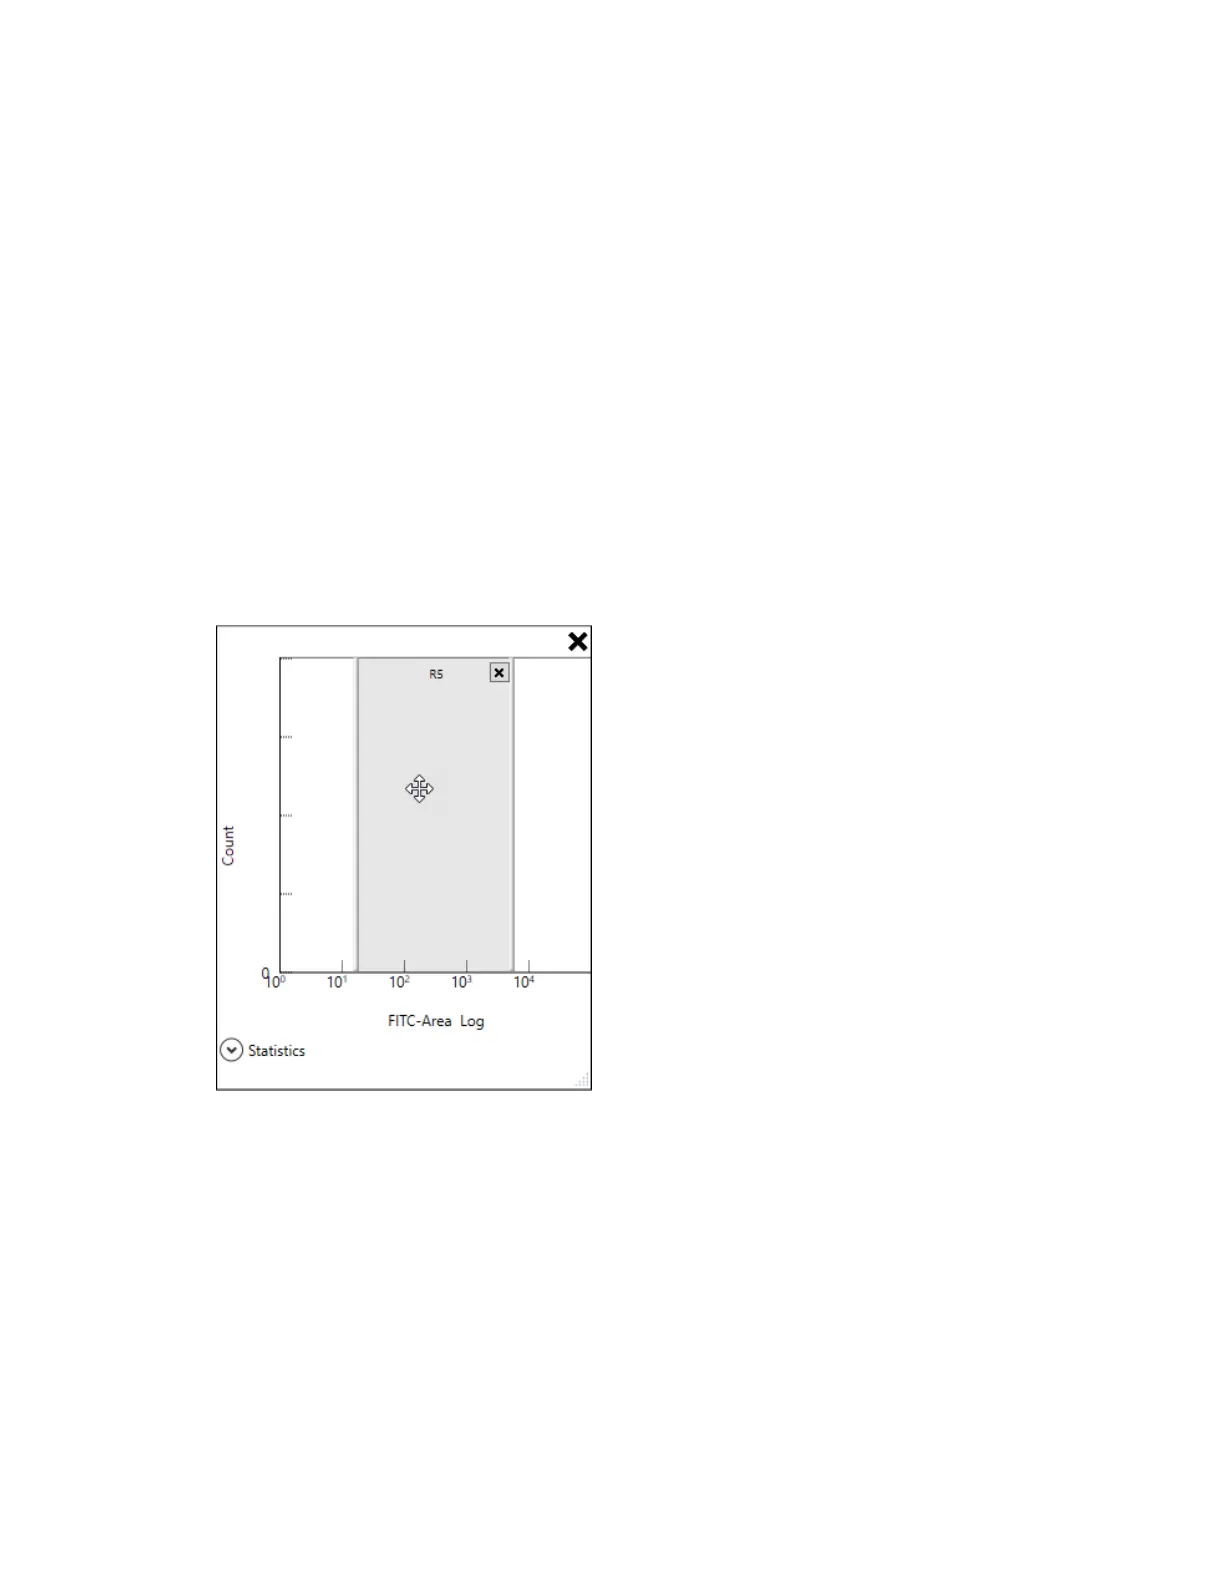
The only type of region you can add to a histogram is a bar region, also known as a range.
To add a bar region to a histogram
1. Point to the histogram.
The plot and histogram toolbar appears.
2. In the plot and histogram toolbar, click Add Bar Region.
A bar region is added to the histogram.
3. To move the bar region to the left or right, point inside the region.
When the pointer changes to a four-headed arrow, use it to drag the bar region.
4. To resize the bar region, point to its left or right edge.
234 | ZE5 Cell Analyzer and Everest Software