Appendix B Example 9-Color Immunophenotyping Experiment
Tip: For more information about images, see Position Images on page 76.
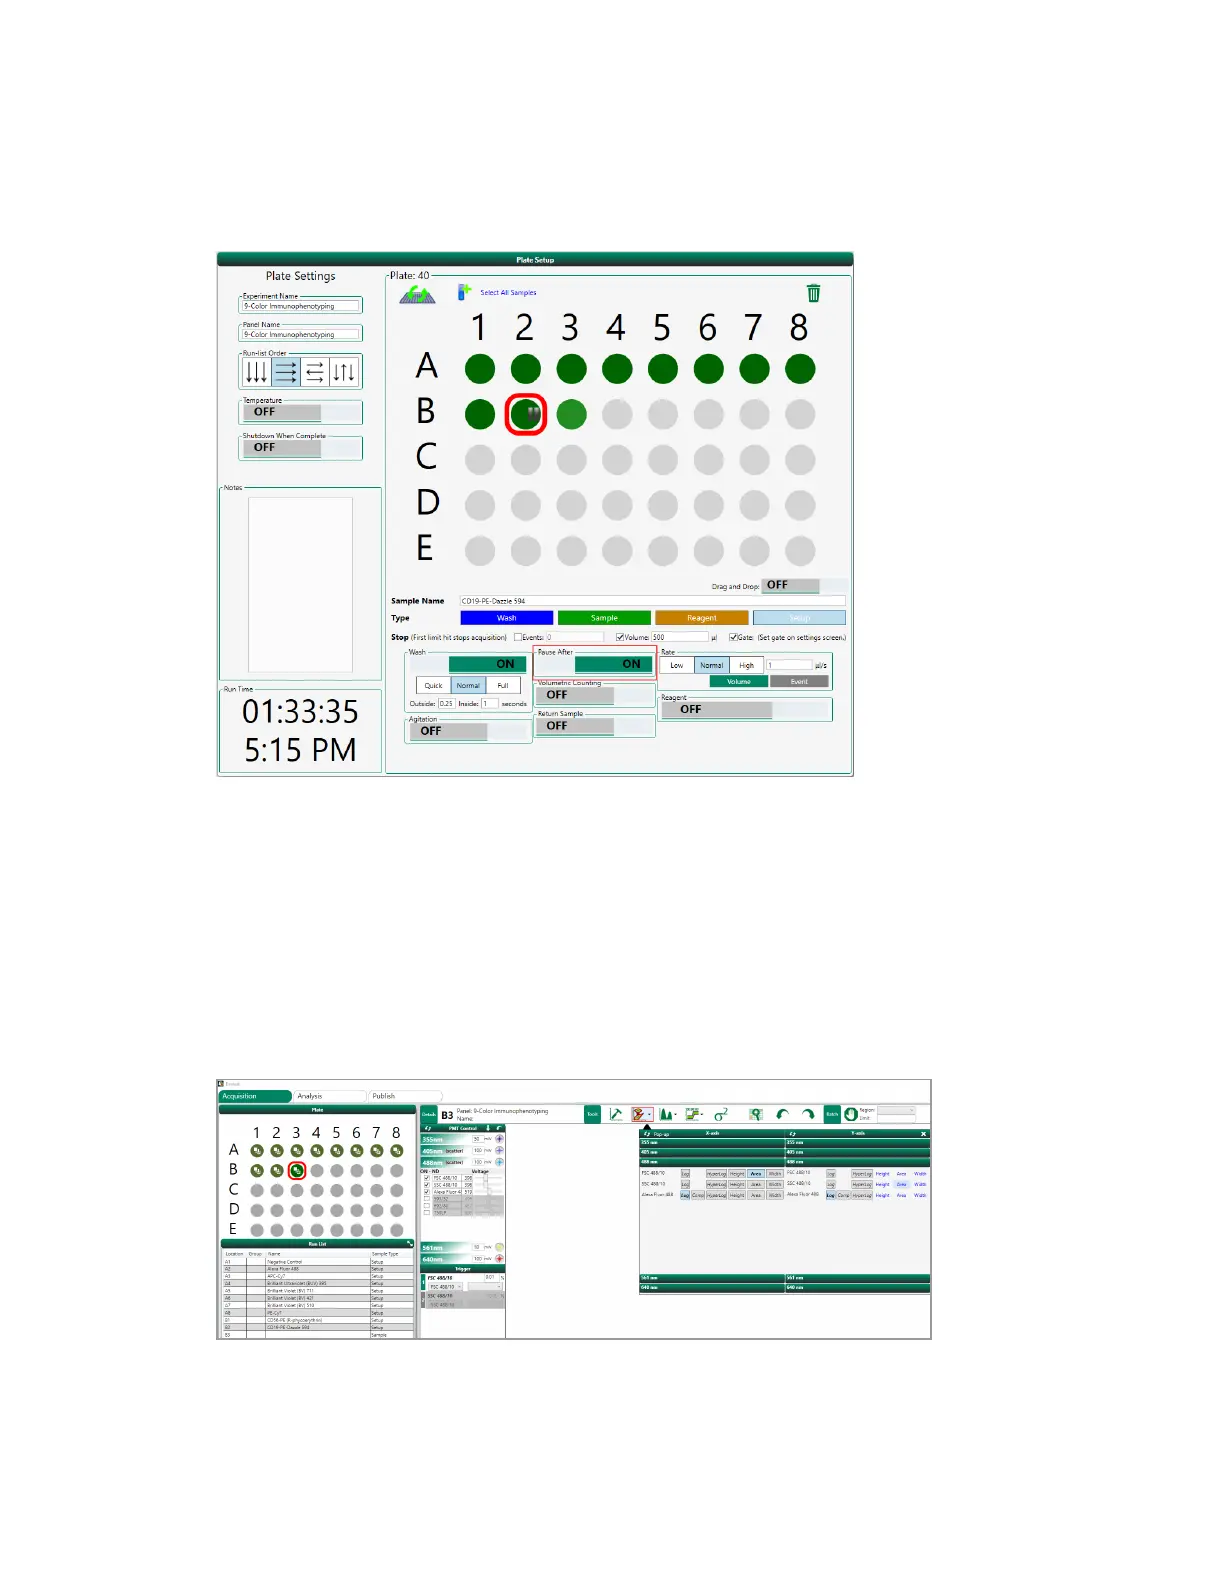
6. When sample setup is complete, click the Next arrow.
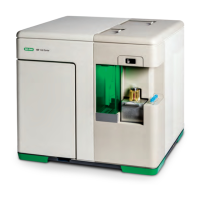
Plots are created automatically for the controls.
Creating Plots for the Experimental Sample
1. Click the sample position in the plate map and click Create Density Plot.
2. Create a forward scatter versus side scatter plot (FSC/SSC) for the 488 laser.
366 | ZE5 Cell Analyzer and Everest Software


 To Next Page