Creating Plots for the Experimental Sample
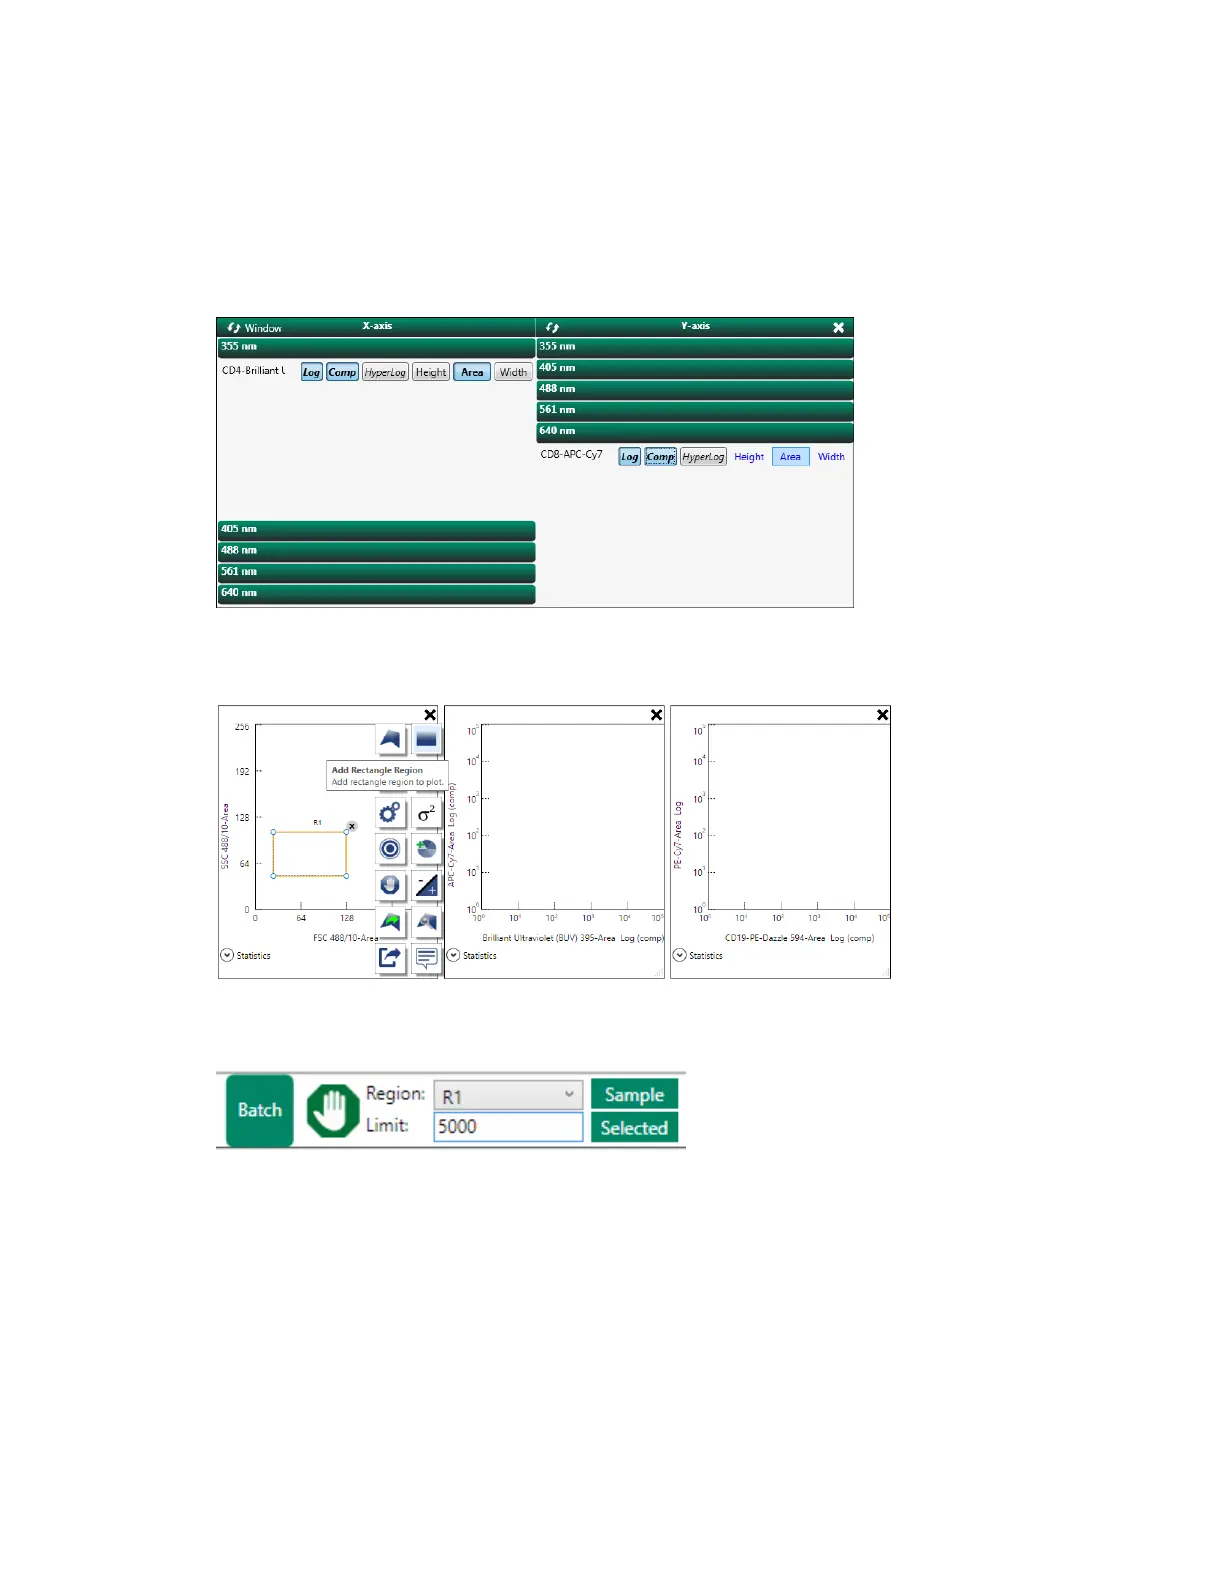
3. Create plots for the remaining parameters in the experiment. For each plot, click Comp so that the
plots will display compensated data.
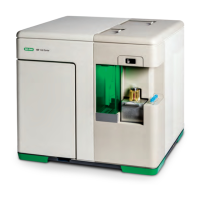
4. Create a region in the FSC/SSC plot.
This region will be used to apply a gate limit to the other plots.
5. In the Gate area of the toolbar, apply a gate limit to the sample by typing a value in the Limit box
and then clicking Sample.
This gate limit will be the stop limit for sample acquisition.
User Guide | 367


 To Next Page