Analyzing Data
Analysis Toolbar
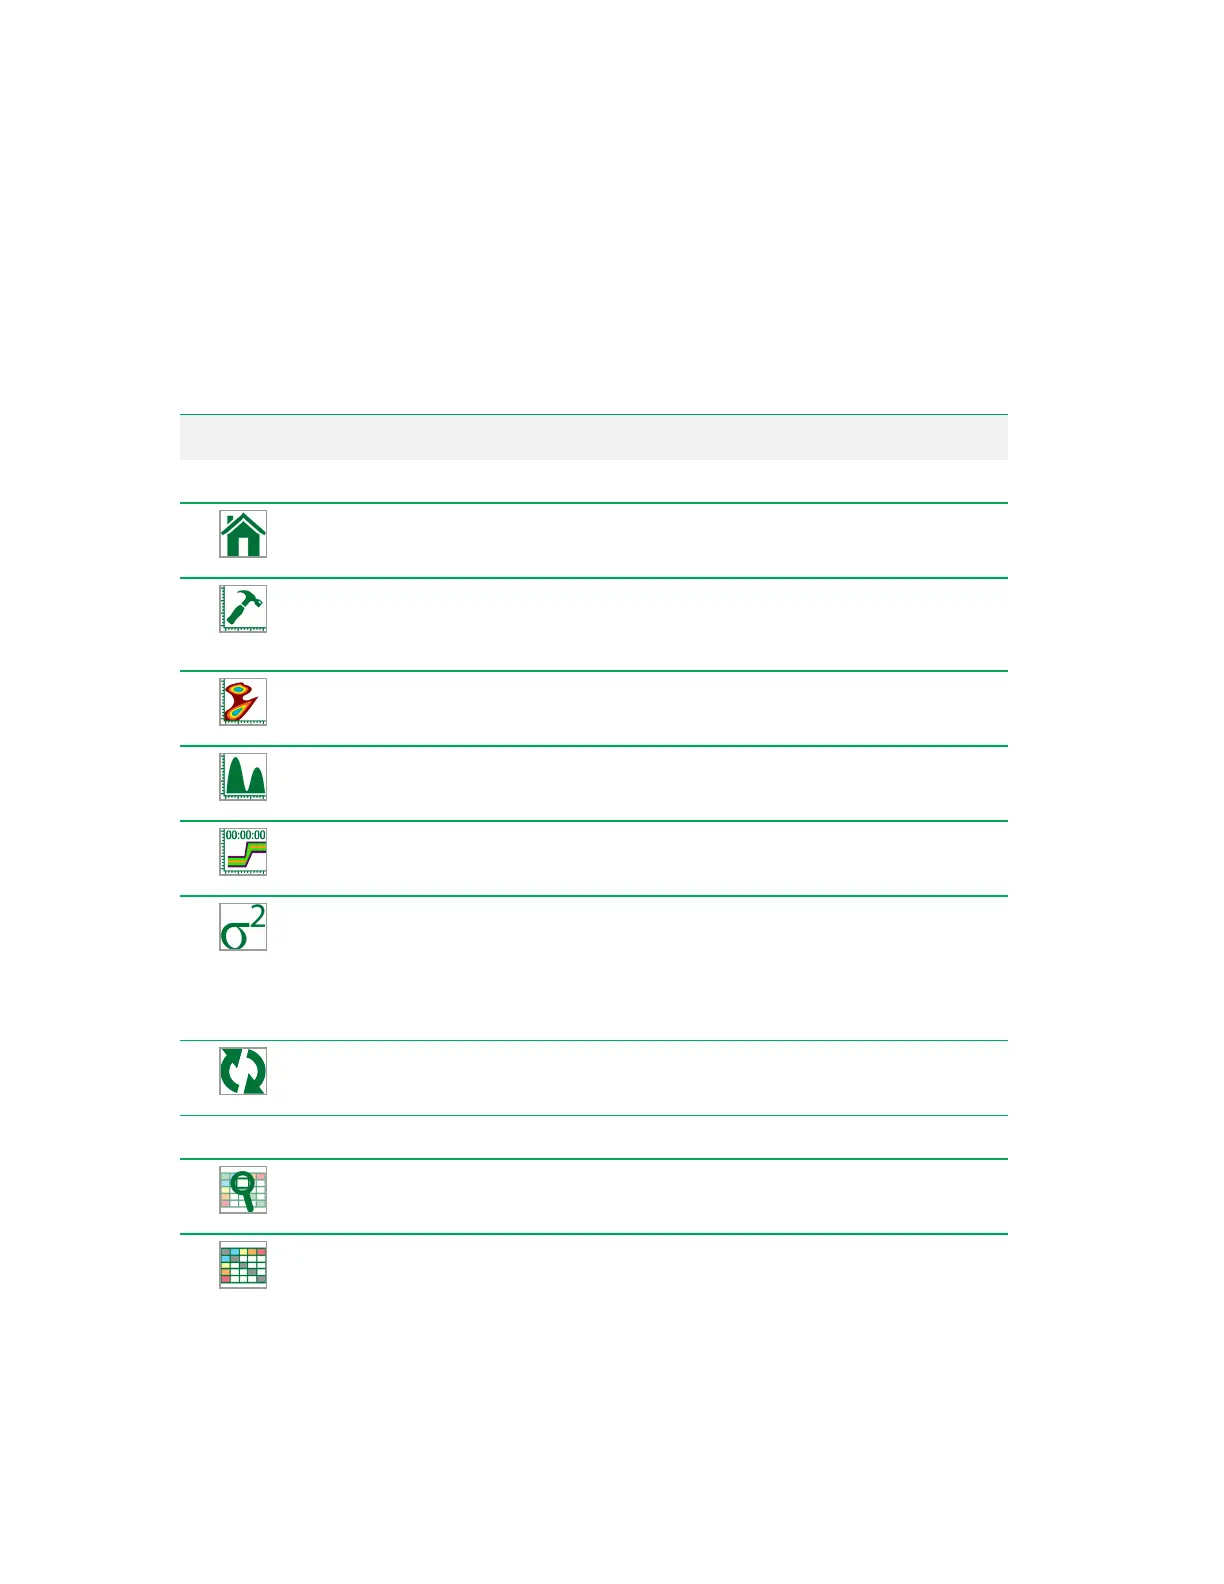
In the Analysis tab, the toolbar contains three sections of tools to assist in performing data analysis:
Tools, Comp, and Share.
Button Function
Tools
Home
— returns to the Analysis start window, where you can load a new experiment to
analyze or resume analysis of the current experiment.
Advanced Plot Builder
— facilitates creation of plots for all parameters, with constraints
that you define. For more information, see Creating Histograms for All Channels on page
214.
Create Density Plot
— creates a bivariate (two-parameter) density plot. For more
information, see Creating Density Plots on page 211.
Create Histogram
— creates a univariate (one-parameter) histogram. For more
information, see Creating Histograms on page 212.
Create Time Plot
— creates a plot of time (x-axis) versus a selected parameter (y-axis).
For more information, see Creating Time Plots on page 213.
Add statistics
— opens a statistics window; in it, you can select the plot statistics to
display for a particular filter (gate), such as concentration, count, CV, percent of total,
maximum, mean, median, minimum, mode, percent of plot, standard deviation, and
variance. For more information, see Managing Plot Statistics on page 221, Viewing and
Rearranging Plot Statistics on page 222, and Comparing Statistics on page 223.
Refresh
— refreshes data displayed on plots in the Analysis workspace.
Comp
View Compensation Matrix
— opens the compensation matrix in the workspace for
viewing or editing.
Auto Compensation
— automatically compensates data displayed in plots. Available
only in the Analysis tab.
Table 41. Analysis toolbar buttons and their functions
User Guide | 305


 To Next Page