Using Plot and Histogram Tools
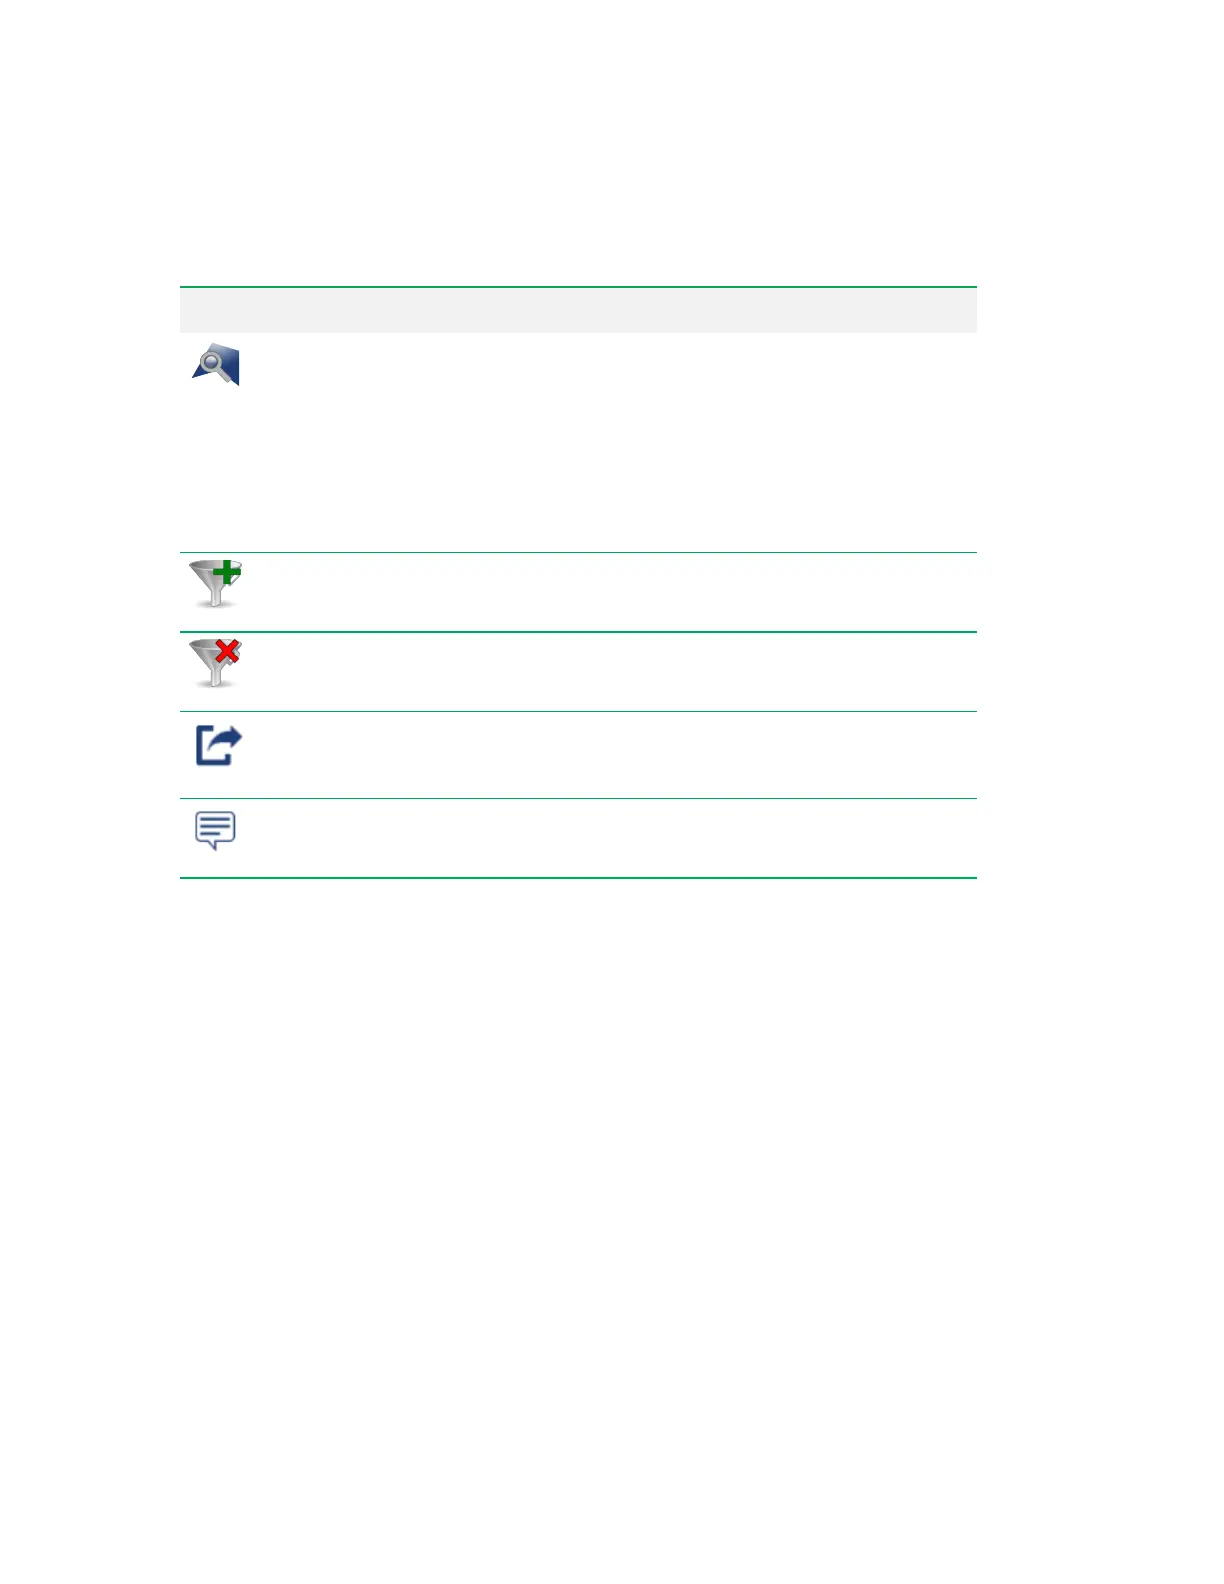
Tool Function Further information
Assign Data Track Regions
—
allows you to specify target event
percentage for a region within a plot. If
the event percentage within the region
does not reach the target, acquisition
pauses. Useful as a clog-detection tool
when utilized with the scatter gate.
Applies only to density plots.
Assigning Data Track Regions on page 242
Apply Filter
— applies a gate
assignment to the plot.
Applying Filters (Gates) on page 236
Remove Filter
— removes a gate
assignment from the plot.
Applying Filters (Gates) on page 236
Export to PNG
— saves a PNG of
the plot to a location that you specify.
Exporting Plots and Histograms on page
256
Add Annotation
— allows you to add
a note to the plot.
Adding Annotations to Plots on page 251
Table 37. Plot and histogram tools and their functions, continued
Modifying Plot Parameters
For each axis of a plot or histogram, you can customize parameters such as selected fluorophore, log
decade, pulse parameter, and bin count.
1. Point to a plot or histogram for which you want to modify parameters.
The plot and histogram toolbar appears.
2. Click Modify Plot Parameters.
User Guide | 219


 To Next Page