Chapter 7 Creating Experiments and Workspaces
Tool Function Further information
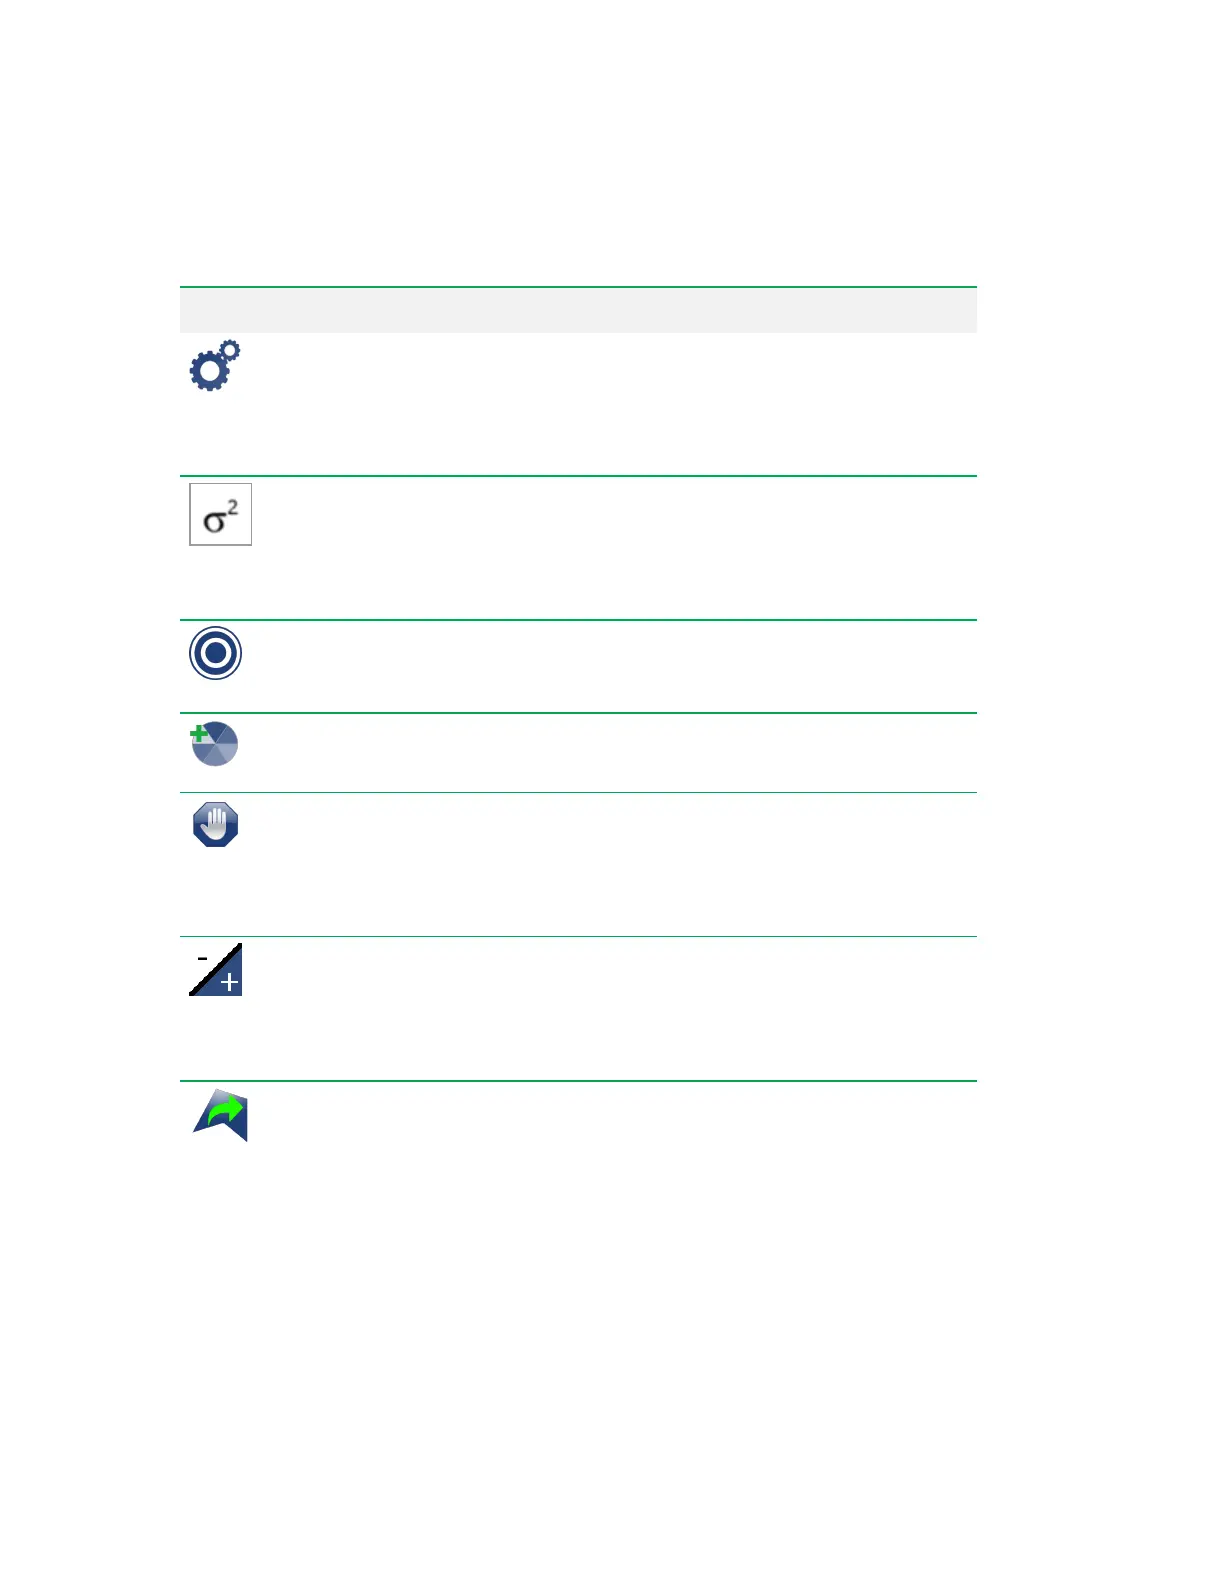
Modify Plot Parameters
— allows
you to modify plot parameters such as
fluorophore, log decade,
compensation, height, width, area, and
bin count.
Modifying Plot Parameters on page 219
Manage Statistics
— allows you to
select the plot statistics to display,
such as count, percent, mean, max,
min, mode, median, standard deviation,
variance, and CV.
Managing Plot Statistics on page 221
Assign Hit Regions
— allows you to
specify a hit detection region. Applies
only to density plots and histograms.
Configuring Hit Detection on page 247
Assign Heat Map Region
— allows
you to add regions to a heat map.
Applying Heat Maps on page 244
Assign Gate Limit Regions
—
allows you to assign a gate limit to a
region so that acquisition stops when
the event count in the region reaches
the specified limit.
Applying Filters (Gates) on page 236
Add Diagonal Separation
— adds a
diagonal line to the plot. This graphical
element can aid you in setting PMT
voltages for compensation. Applies
only to density plots.
Adding Diagonal Separators to Plots on
page 249
Apply Gate to All Plots
— allows
you to either apply a gate (region) to all
plots or copy a region and create an
identical one in all other plots of the
same type in the workspace.
Applying a Region to All Plots on page 250
Table 37. Plot and histogram tools and their functions, continued
218 | ZE5 Cell Analyzer and Everest Software


 To Next Page