Chapter 10 Analyzing, Saving, and Printing Data
Button Function
Share
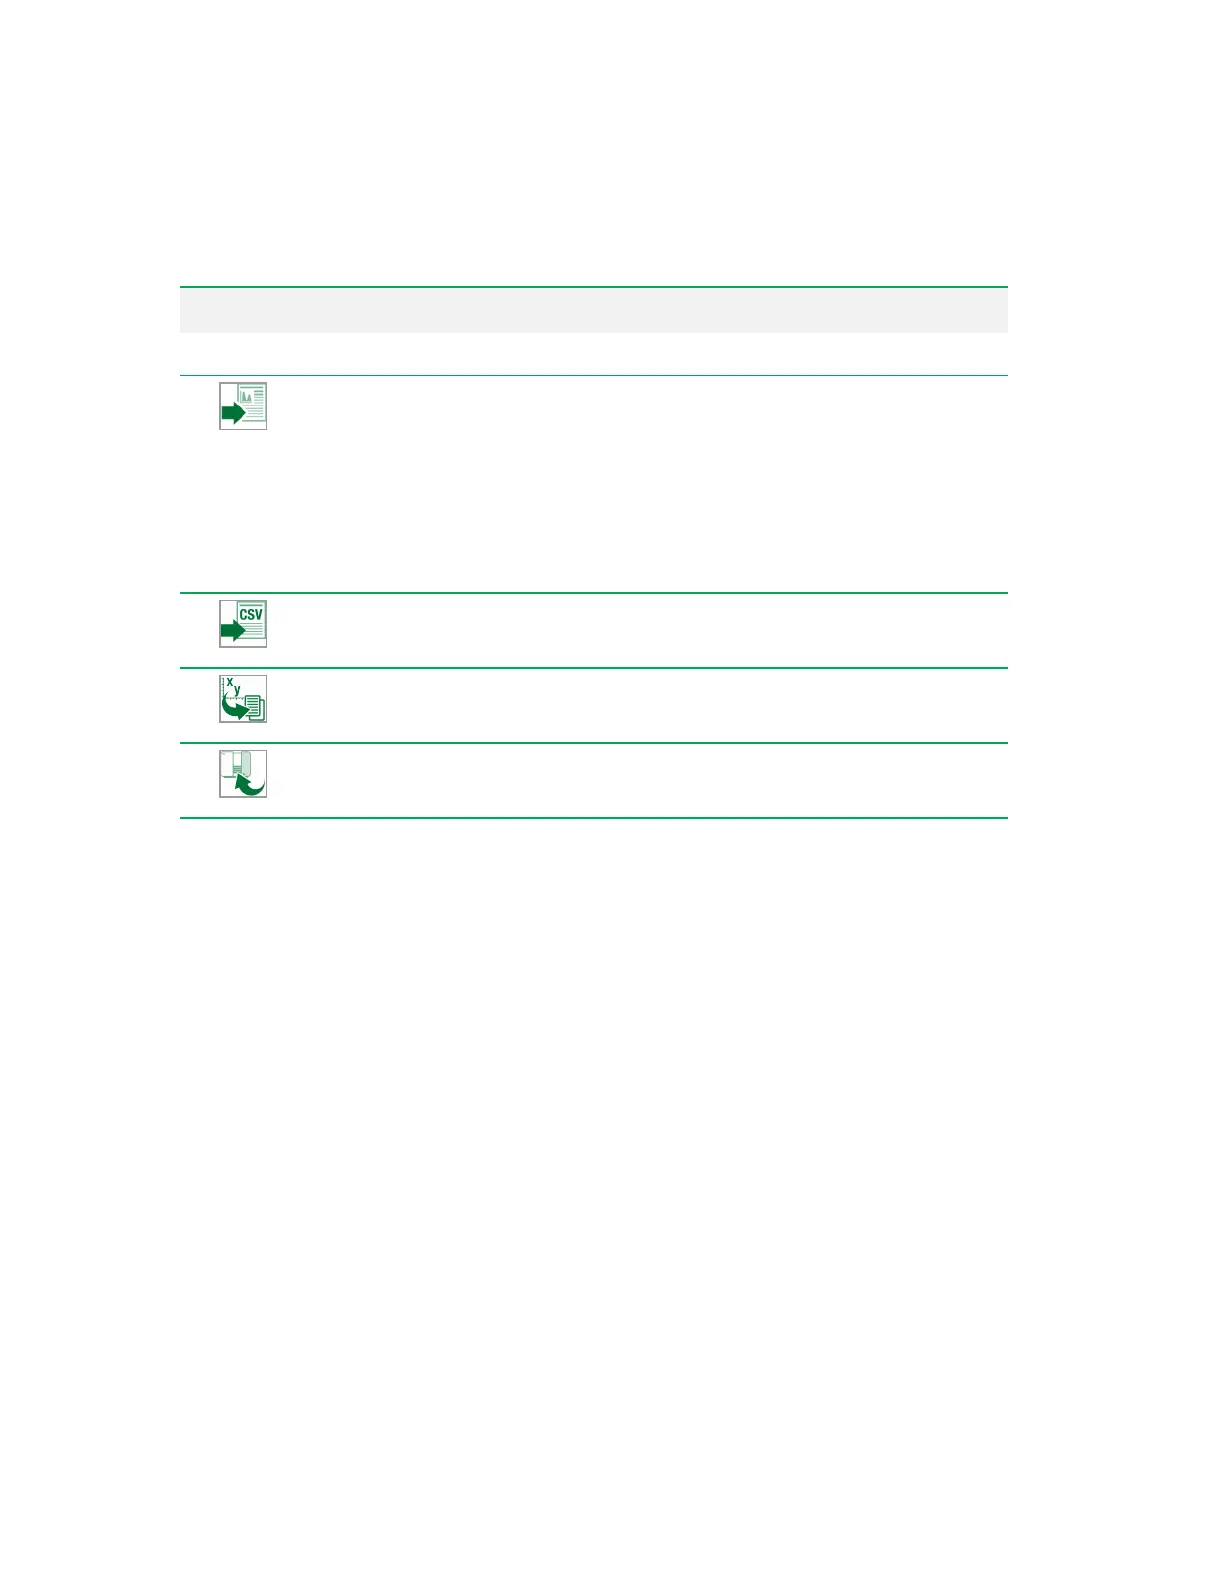
Export Data
— allows you to select from five export options:
n Export FCS file for a single position.
n Export all FCS files for the current experiment.
n Export most recent FCS file for each position and compress to ZIP.
n Export run list to RLST format and export all FCS files for the current experiment.
n Export full experiment, including run list, telemetry, and all FCS files for each position;
compress to ZIP.
Export Data to CSV
— allows you to select statistics and export them to a comma-
delimited file.
Move to Publish
— transfer the experiment to the Publish tab and display a report for the
selected position.
Send Run List to Local Instrument
— send updated run list back to instrument for
acquisition (for example, after compensation is applied).
Table 41. Analysis toolbar buttons and their functions, continued
Working with Plots and Statistics in the Analysis Tab
In the Analysis tab, you can continue to modify experiment plots and statistics using the same controls
that were available on the Acquisition tab. For more information, see these sections:
n Creating Plots and Histograms on page 209
n Using Plot and Histogram Tools on page 217
n Managing Plot Statistics on page 221
Note: You can adjust compensation by dragging outside a region in a compensation plot. When
dragging items in plots, ensure that you do not adjust compensation unintentionally. For more
information, see Dragging Populations on page 298.
Click Refresh in the Tools section of the toolbar to update the displayed data.
306 | ZE5 Cell Analyzer and Everest Software


 To Next Page