Chapter 7 Creating Experiments and Workspaces
The plot is added to the workspace.
6. Click the X or click outside the plot creation dialog box to close it.
Creating Histograms for All Channels
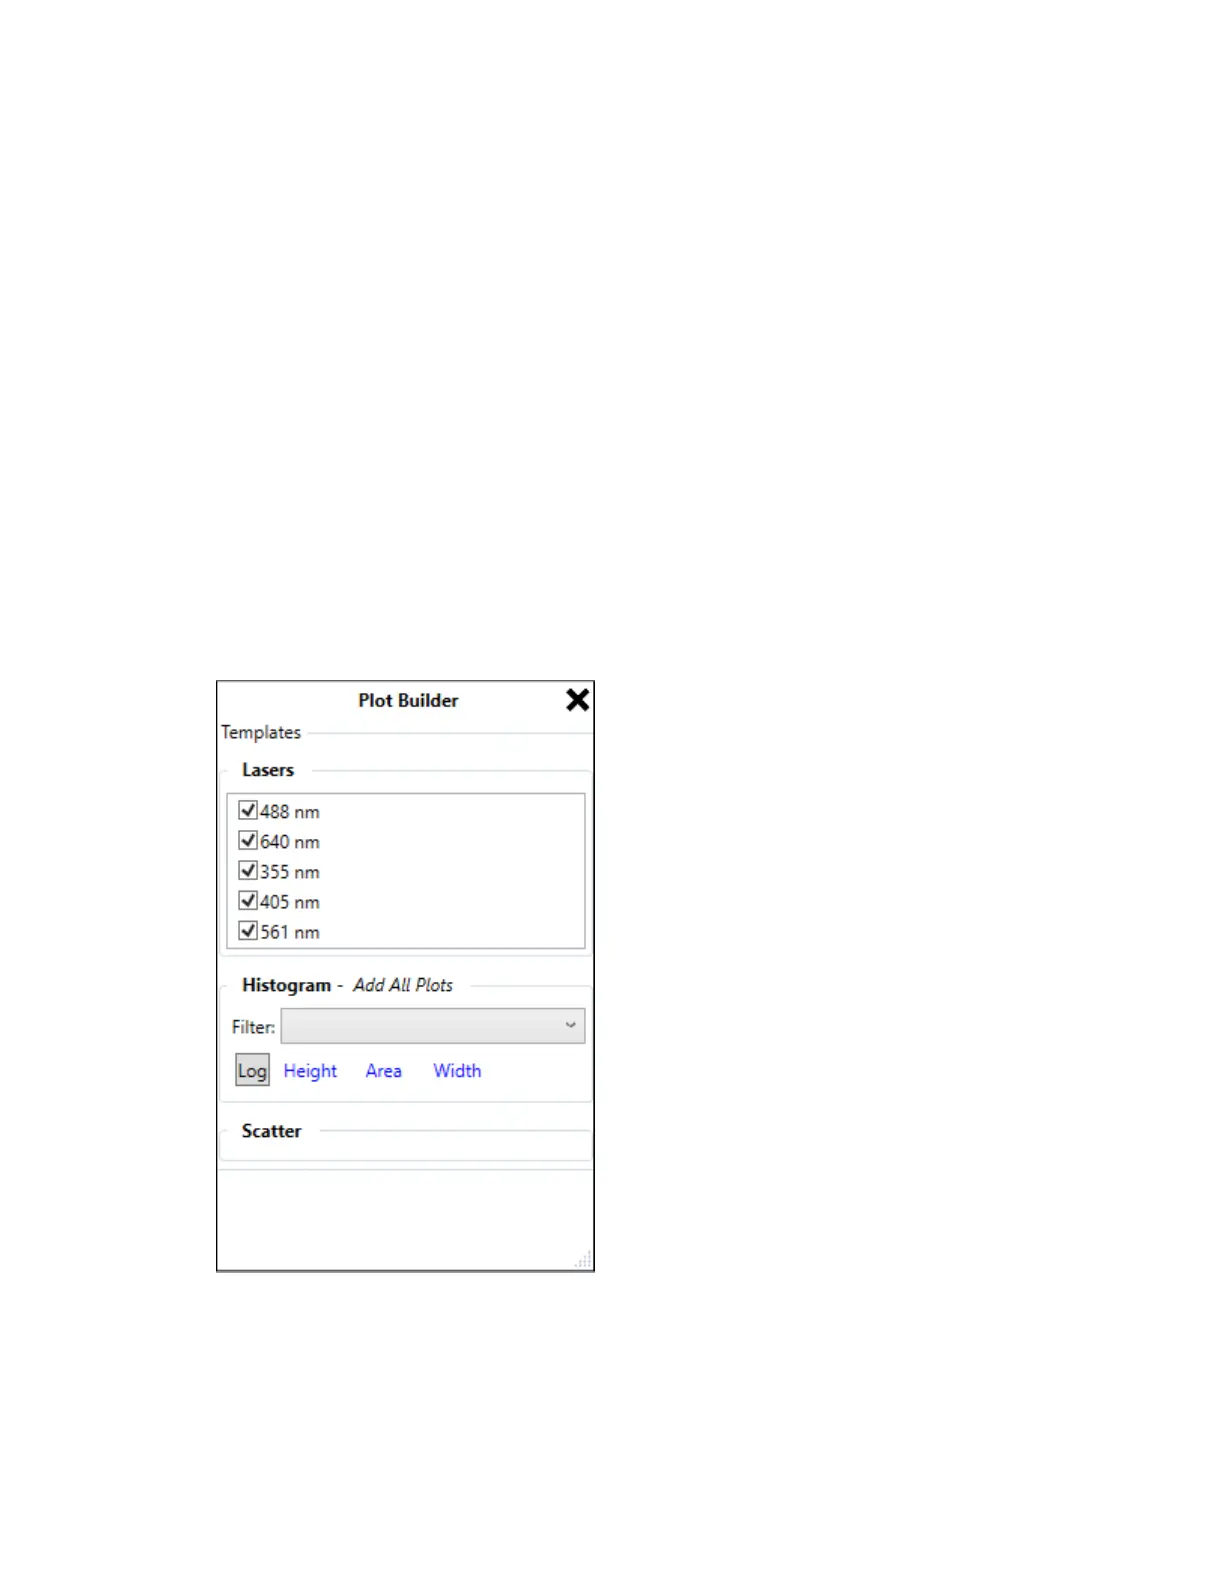
Everest Software allows you to automatically create histograms for all parameters. In the plot
(histogram) builder, you can apply filters (gates) to all histograms; specify whether histogram data are
displayed in linear, log, or hyperlog scale; and specify the pulse measurement (area, height, or width).
Tip: Histograms are created only for parameters that are activated in the workspace. Checkboxes
next to each laser allow you to specify histogram creation for a particular detection path.
To create histograms for all channels
1. Click Advanced Plot Builder in the toolbar.
The plot (histogram) builder opens.
2. Clear the checkbox for any laser detection path that you do not want to include.
214 | ZE5 Cell Analyzer and Everest Software


 To Next Page