Chapter 4 Everest Software
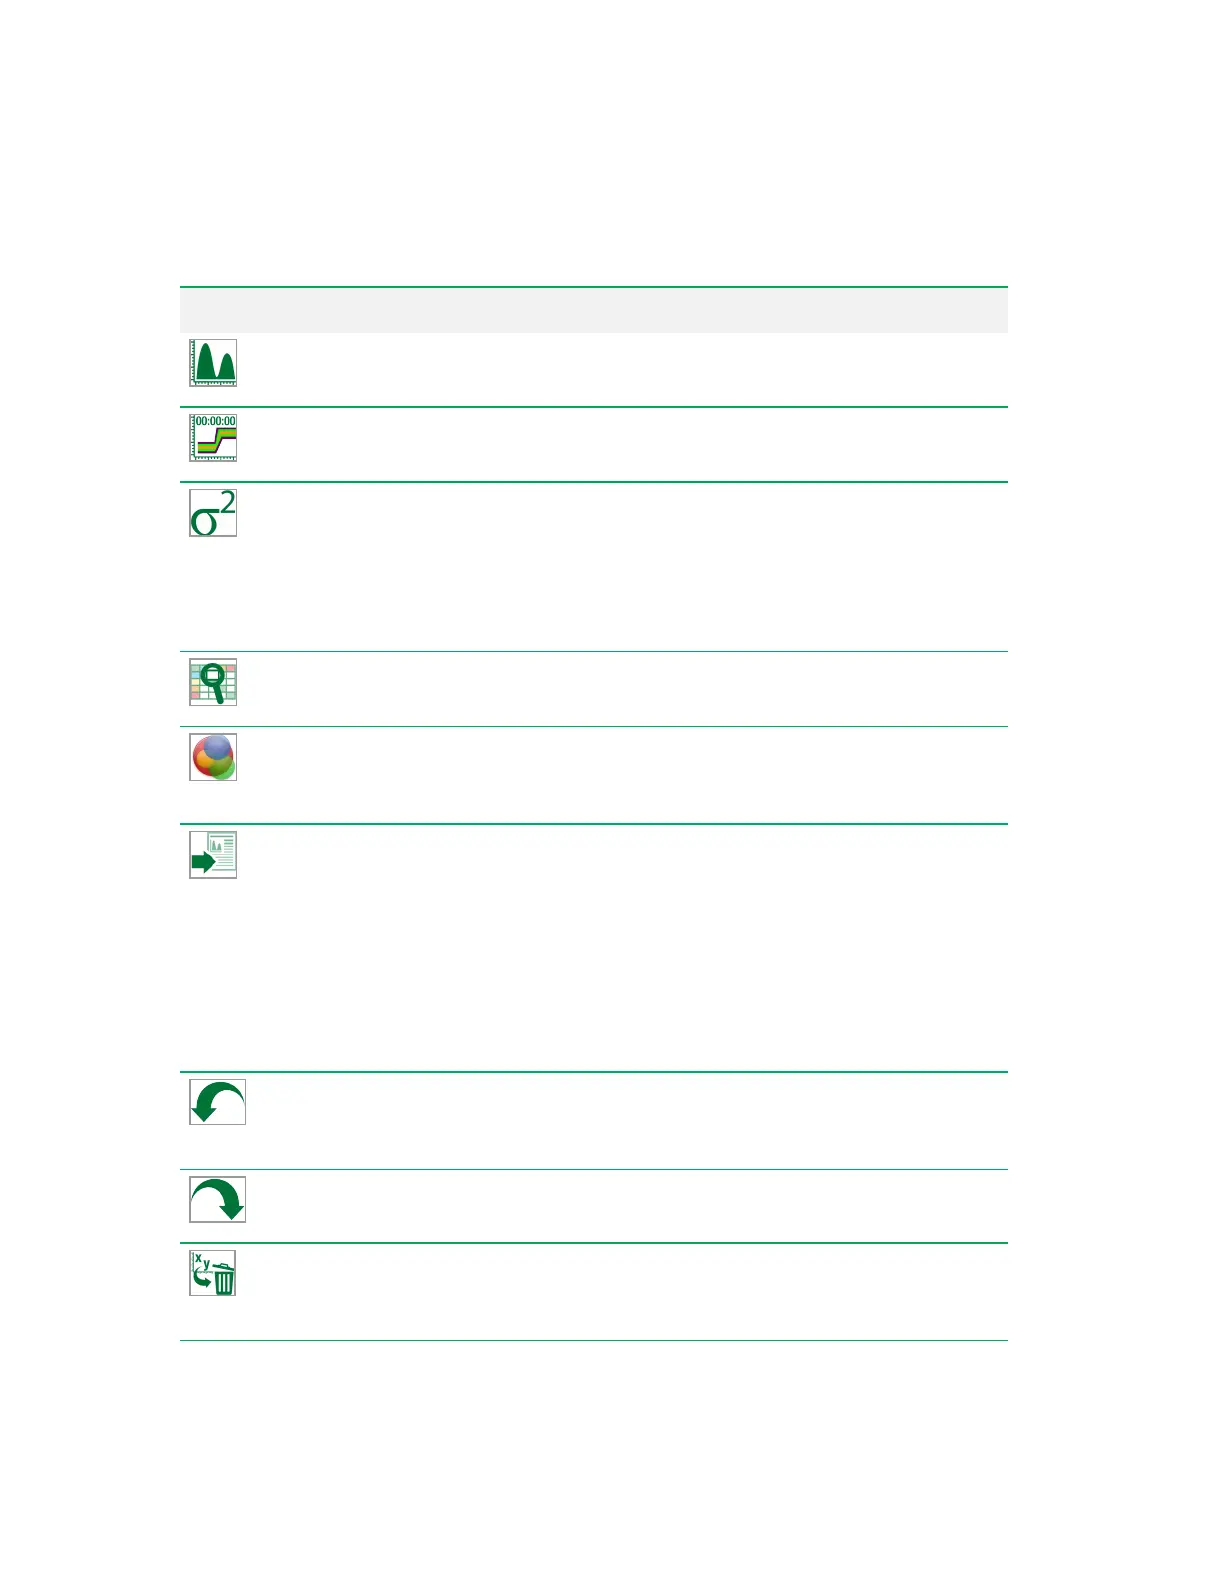
Button Function
Create Histogram
— creates a univariate (one-parameter) histogram. For more
information, see Creating Histograms on page 212.
Create Time Plot
— creates a plot of time (x-axis) versus a selected parameter (y-axis).
For more information, see Creating Time Plots on page 213.
Add Statistics
— opens a statistics window; in it, you can select the plot statistics to
display for a particular filter (gate), such as concentration, count, CV, percent of total,
maximum, mean, median, minimum, mode, percent of plot, standard deviation, and
variance. This window also displays the gating hierarchy. For more information, see
Managing Plot Statistics on page 221, Viewing and Rearranging Plot Statistics on page
222, and Comparing Statistics on page 223.
View Compensation
— opens the compensation matrix in the workspace for viewing or
editing.
Optical Filter Configuration
— displays the current optical filter configuration for all
detection banks. Also allows you to initiate the ZE5-EYE process.
Note: This tool appears only in the Acquisition workspace toolbar.
Export
— allows you to select from five export options:
n Export FCS file for a single position.
n Export all FCS files for the current experiment.
n Export most recent FCS file for each position and compress to ZIP.
n Export run list to RLST format and export all FCS files for the current experiment.
n Export full experiment, including list, telemetry, and all FCS files for each position;
compress to ZIP.
Note: This tool appears only in the Acquisition workspace toolbar.
Undo
— reverses the last action taken. Applies only to creating, moving, resizing, or
deleting a region or plot; and applying or removing a gate.
Note: This tool appears only in the Settings workspace toolbar.
Redo
— reverses the last Undo action.
Note: This tool appears only in the Settings workspace toolbar.
Remove Plots
— removes any plots or histograms that have been added to the
workspace.
Note: This tool appears only in the Settings workspace toolbar.
Table 25. Tools buttons and their functions, continued
94 | ZE5 Cell Analyzer and Everest Software
 Loading...