Using Plot and Histogram Tools
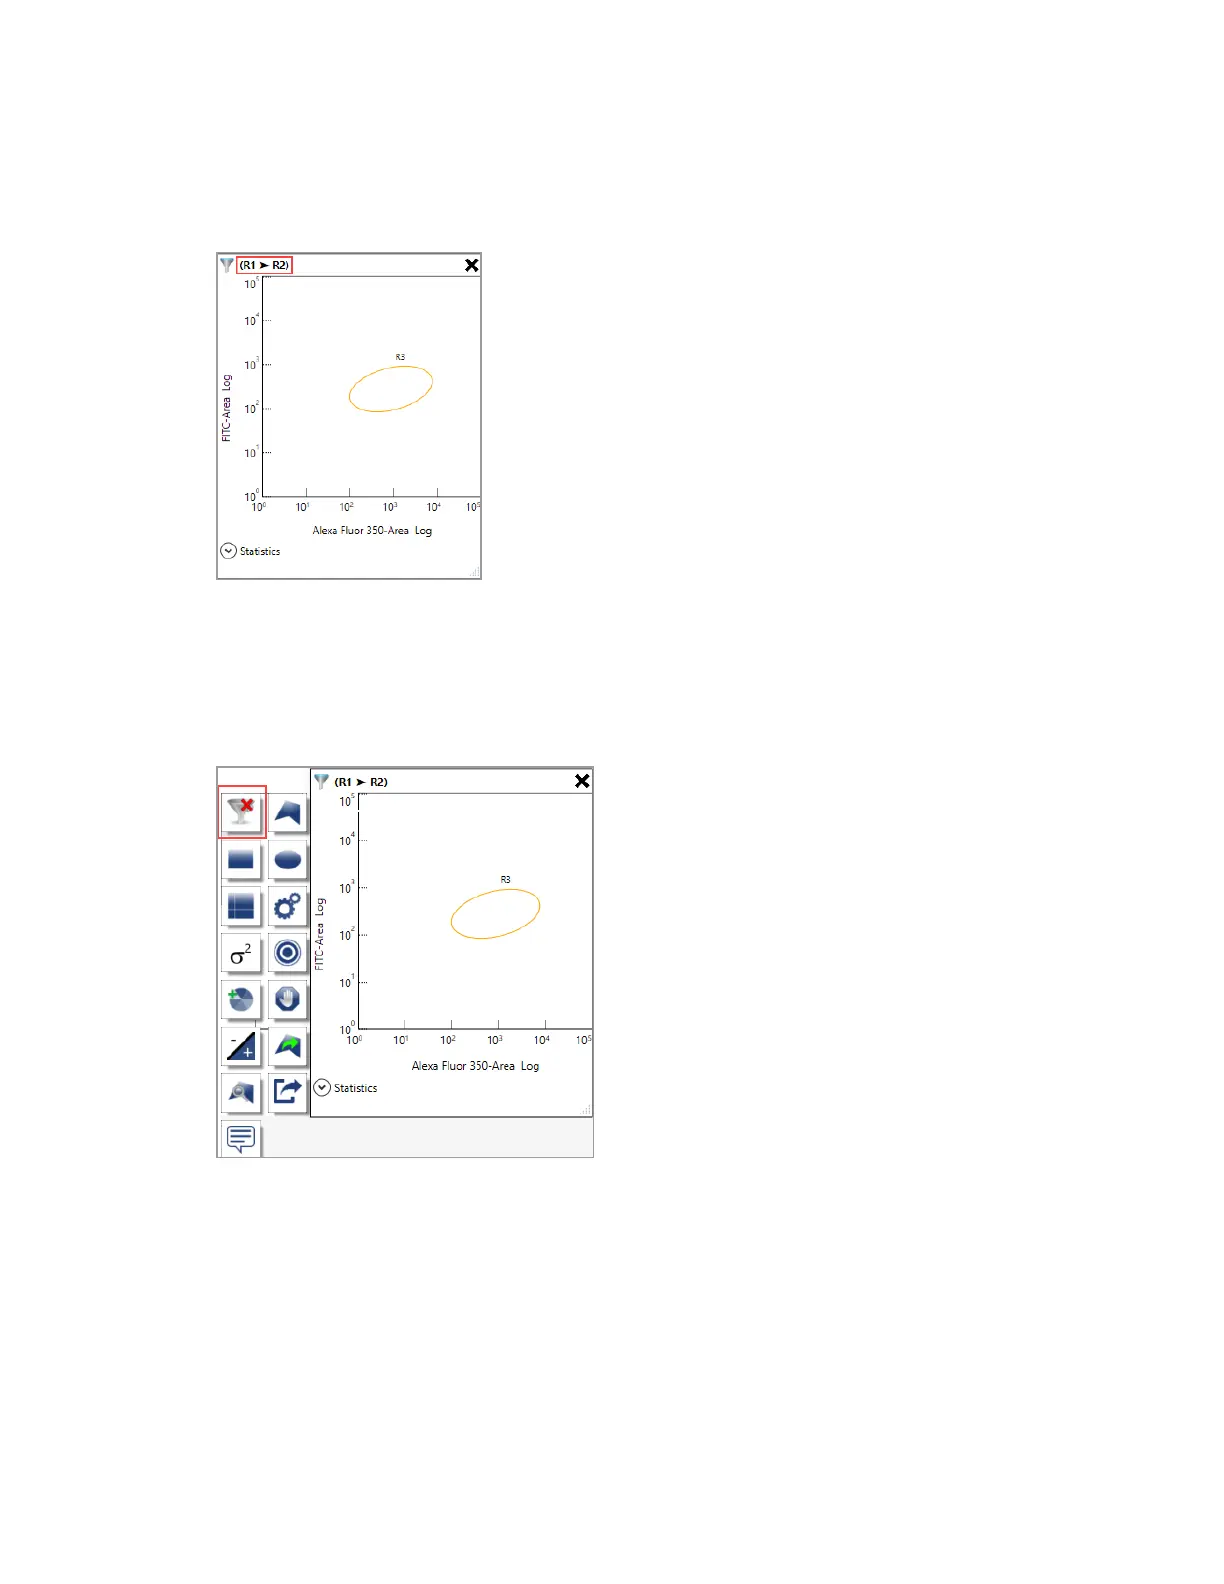
4. The reconfigured plot displays only the data that fall into the region applied in the filter.
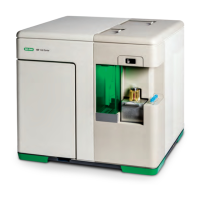
To remove a filter from a plot or histogram
1. Point to the plot or histogram.
2. Click Remove Filter in the plot and histogram toolbar that appears.
The filter is removed form the plot or histogram.
User Guide | 237


 To Next Page