Using Plot and Histogram Tools
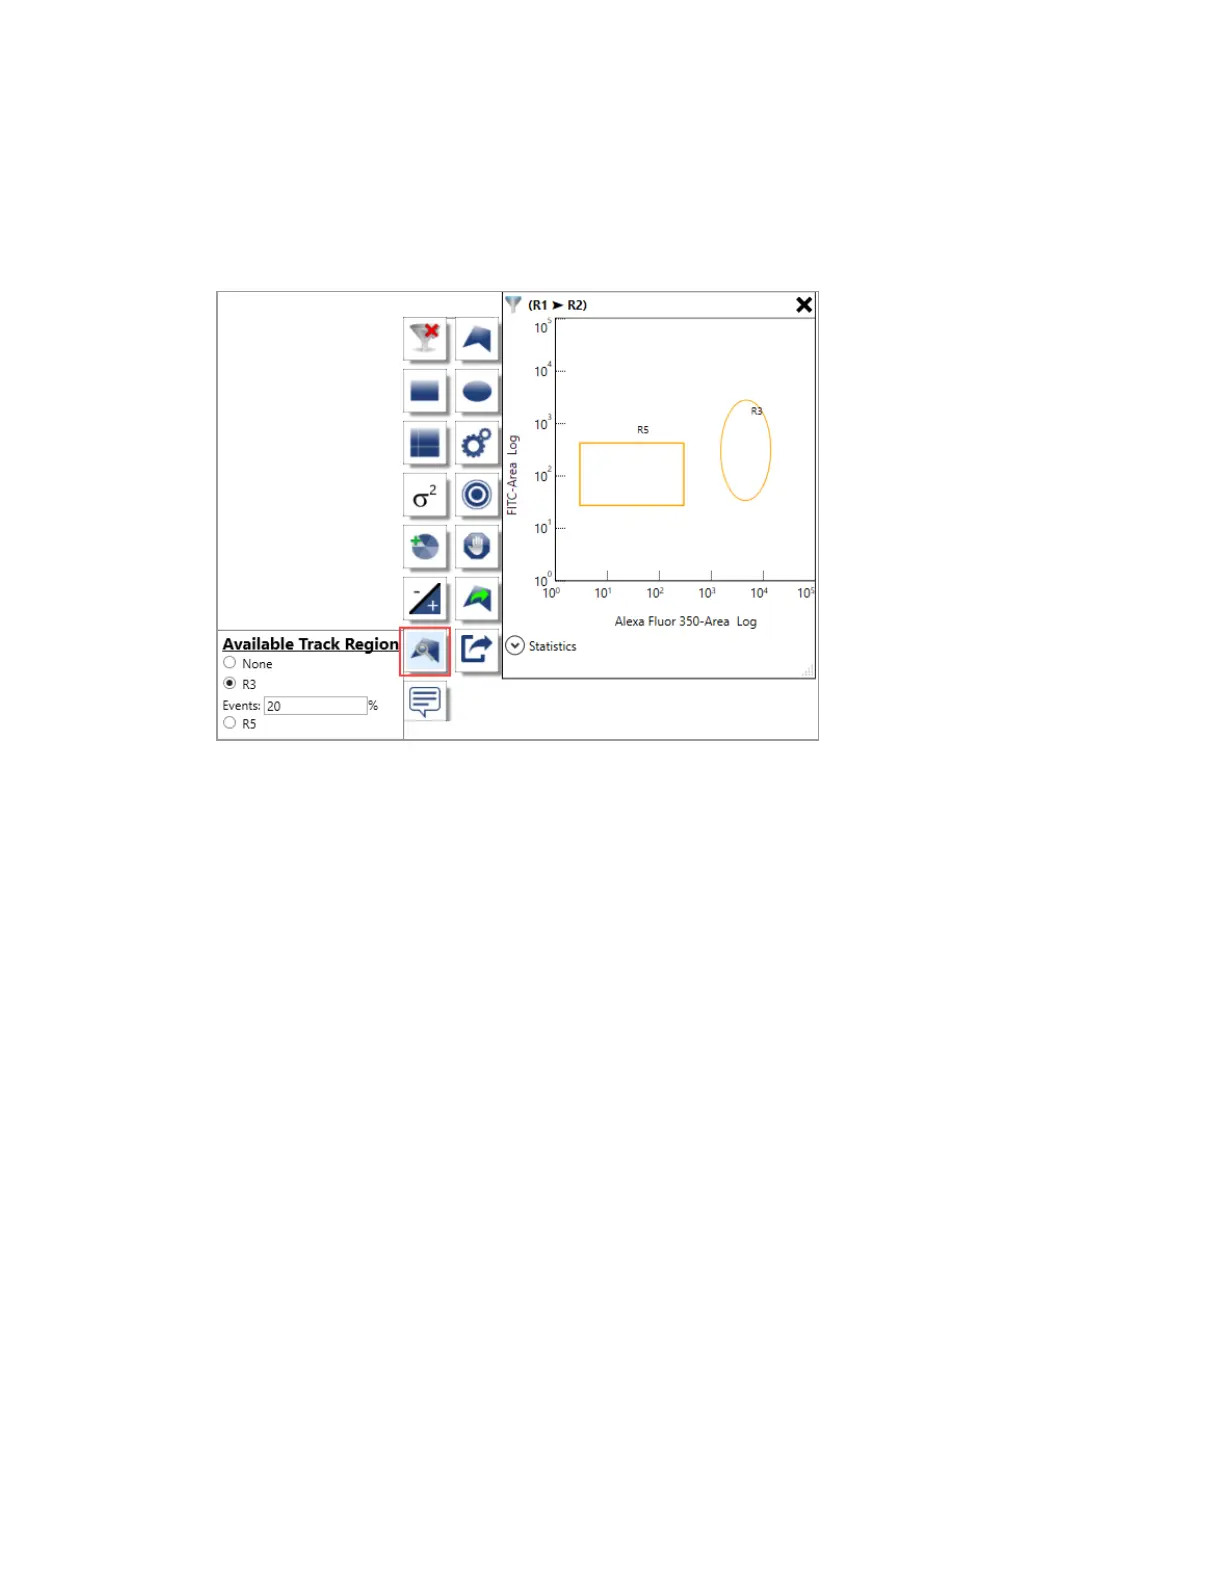
4. If needed, modify the target percentage in the Events box. The default value is 20%.
The tracked region is outlined in blue.
5. Point outside the plot to save your changes.
Note: When specifying the target percentage, leave some room for margin of error to avoid
pausing acquisition for samples with regions that come very close to meeting the target
percentage.
To remove data tracking from a region
1. Point to a density plot that contains the region that uses data tracking.
The plot and histogram toolbar appears.
2. Click Assign Data Track Regions.
3. Select None.
4. Point outside the plot to save your changes.
The region outline reverts to yellow and the region is no longer used for data tracking.
User Guide | 243


 To Next Page