www.dtec.net.au
Chapter 13: Analysing Data (‘View’ Menu)
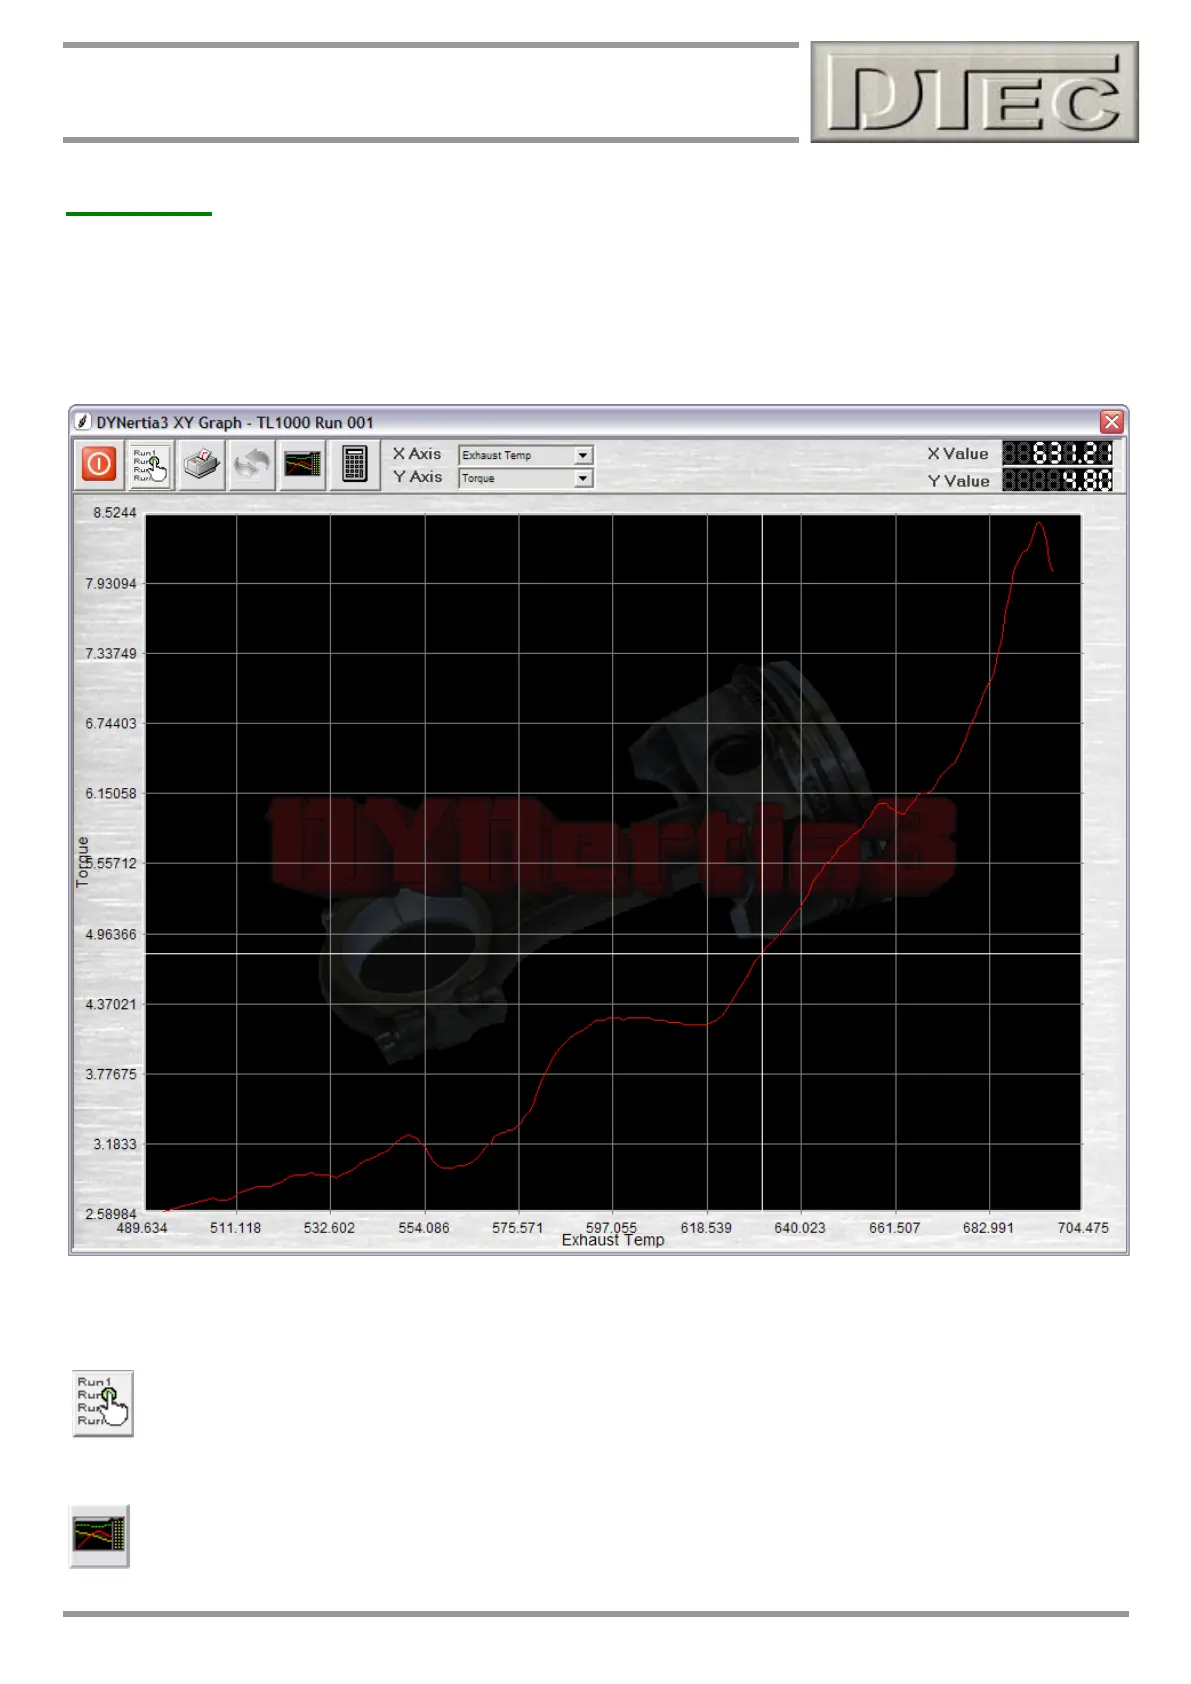
XY Graph
Flexible tool allows plotting of data of choice against another to reveal trends. As the chosen channels can even be
‘maths’ channels there is no limit to the applications. Particularly suited to stable data (e.g. Point by Point recordings)
Drop down selection boxes in the menu bar allow for a choice from any data channel 1 to 5, maths channels, Speed,
RPM, Torque, Power, drive line losses (if enabled) and slip.
Clicking on the Window will reveal a cursor; actual values at the X and Y points are displayed in the menu bar.
Select a Trace to view: Any of the 10 traces loaded into the main Graph Windows can be selected.
Individual Trace view: The trace selected will be shown in the ‘Individual Trace’ Window for a detailed look
at all of the data.