www.dtec.net.au
Chapter 6: Overview- 2 Main Windows
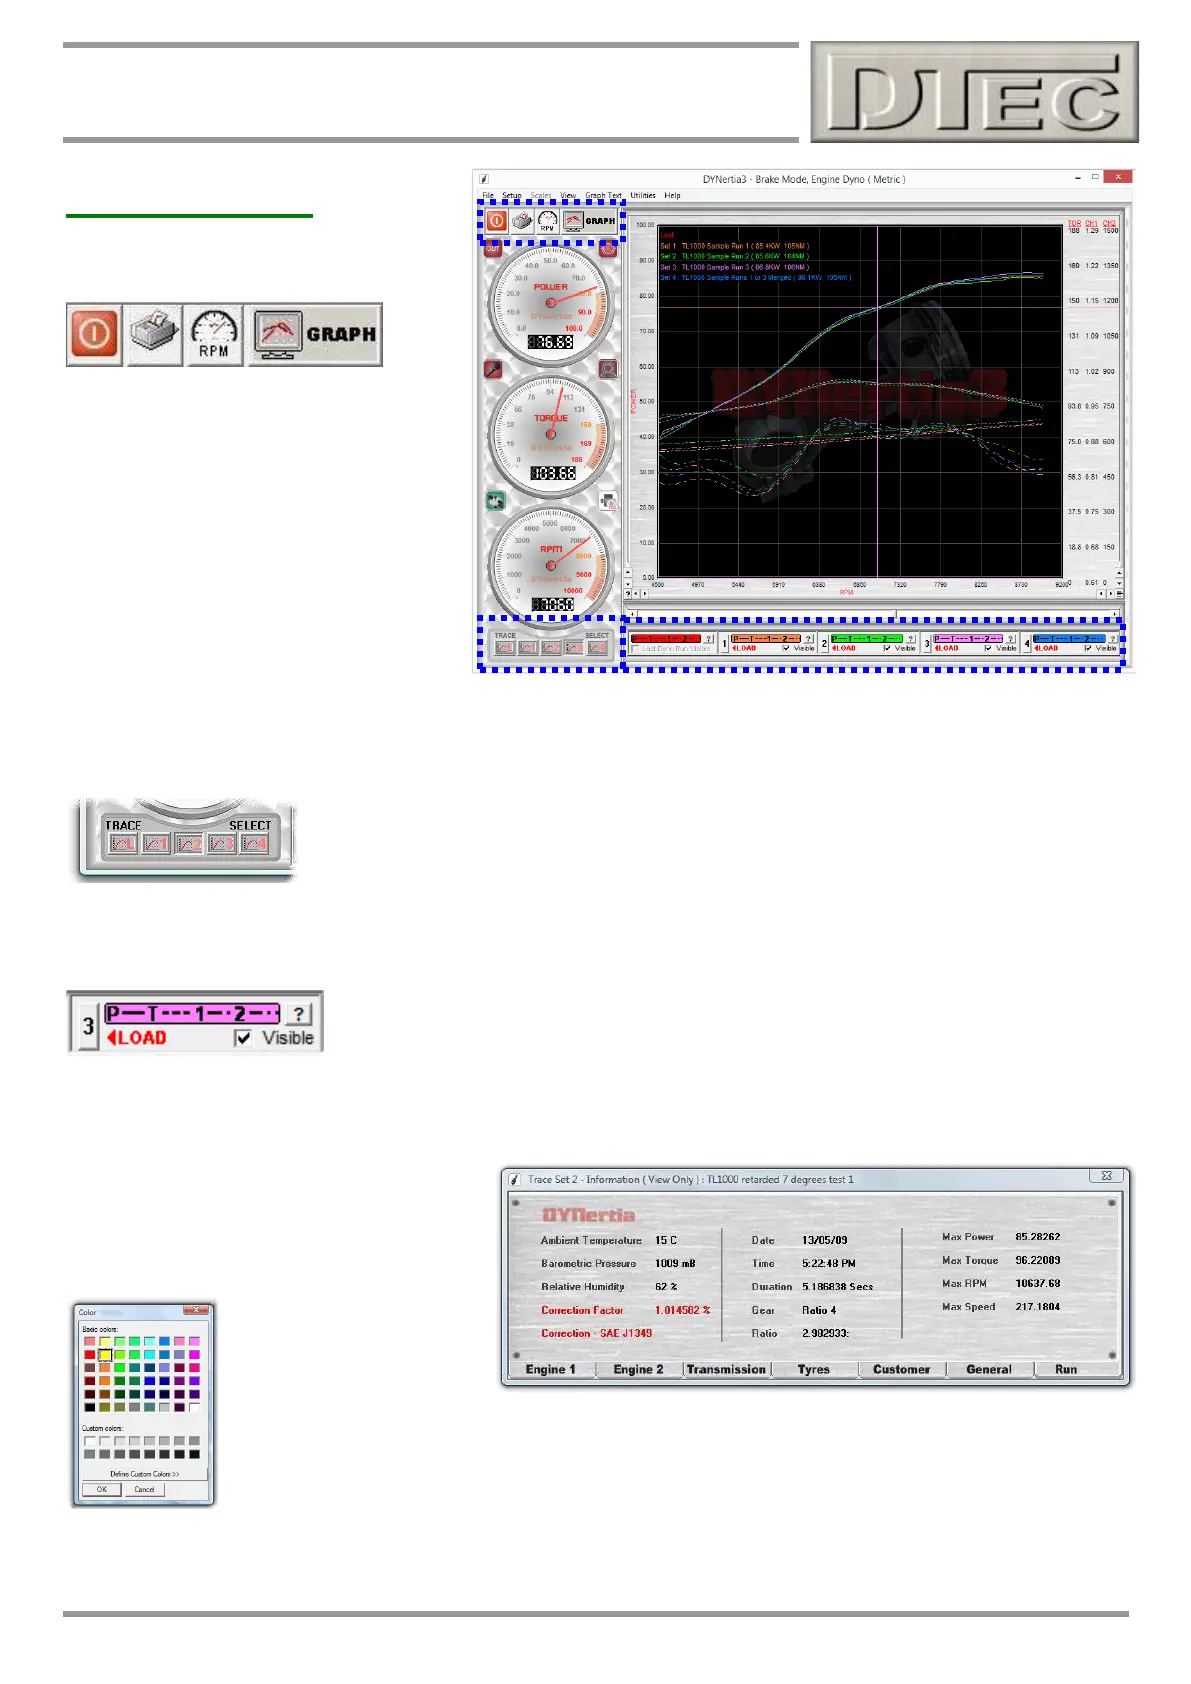
GRAPH Window
Tool Bar Button Functions
Exit: Saves and exits DYNertia3.
Print: Opens the printing menu, same as
the menu option “File/Print”.
RPM/Speed Mode: Switches the dyno
from displaying RPM as the graph X-axis
to speed, also alters the RPM/Speed dial
gauge. Speed is applicable for a chassis
dyno when the roller circumference has
been correctly entered in the menu option
“Setup/Hardware”.
GRAPH/DYNO: Switches between the Dyno Window and the Graph Window. Switching automatically to this Graphing
Window after a test can be chosen in the menu option “Setup/Software/Auto Display Graph of Last Run”.
Selecting Trace to Analyze
Each button selects the data trace on the graph to be analysed (L = Last run). The chosen
trace is the one that will have its values displayed by the dial gauges as the cursor ‘cross
hairs’ are positioned along it.
Tip- Cursor colour matches the colour of the trace selected.
Selecting Trace to Display
To ‘hide’ a trace ‘click’ on its tick box “”. To change its colour ‘click’ on the coloured bar.
To view associated data and notes ‘click’ on the “?” button.
# To actually load a ‘Run’ trace to view, click on the trace number button (Left Hand of each panel, in this case trace “3”)
and the ‘File Explorer’ screen will open to the files location to allow previewing and selecting (by Left and then Right
Clicking on it) of any stored Run file. See chapter “Loading and Viewing Files”
The “?” button for each trace will display the
main test data in summary and any recorded
notes can be viewed an edited by selecting
the appropriate tab.
If you click on the Power and Torque coloured header section (pink in this example) you can select
any display colour from the pallet to associate with this trace number, it will be stored permanently.
Tip- The colours chosen are also used for printing (on a white background), so keep this in mind
and avoid very light colours if printing is planned.