www.dtec.net.au
Chapter 13: Analysing Data (‘View’ Menu)
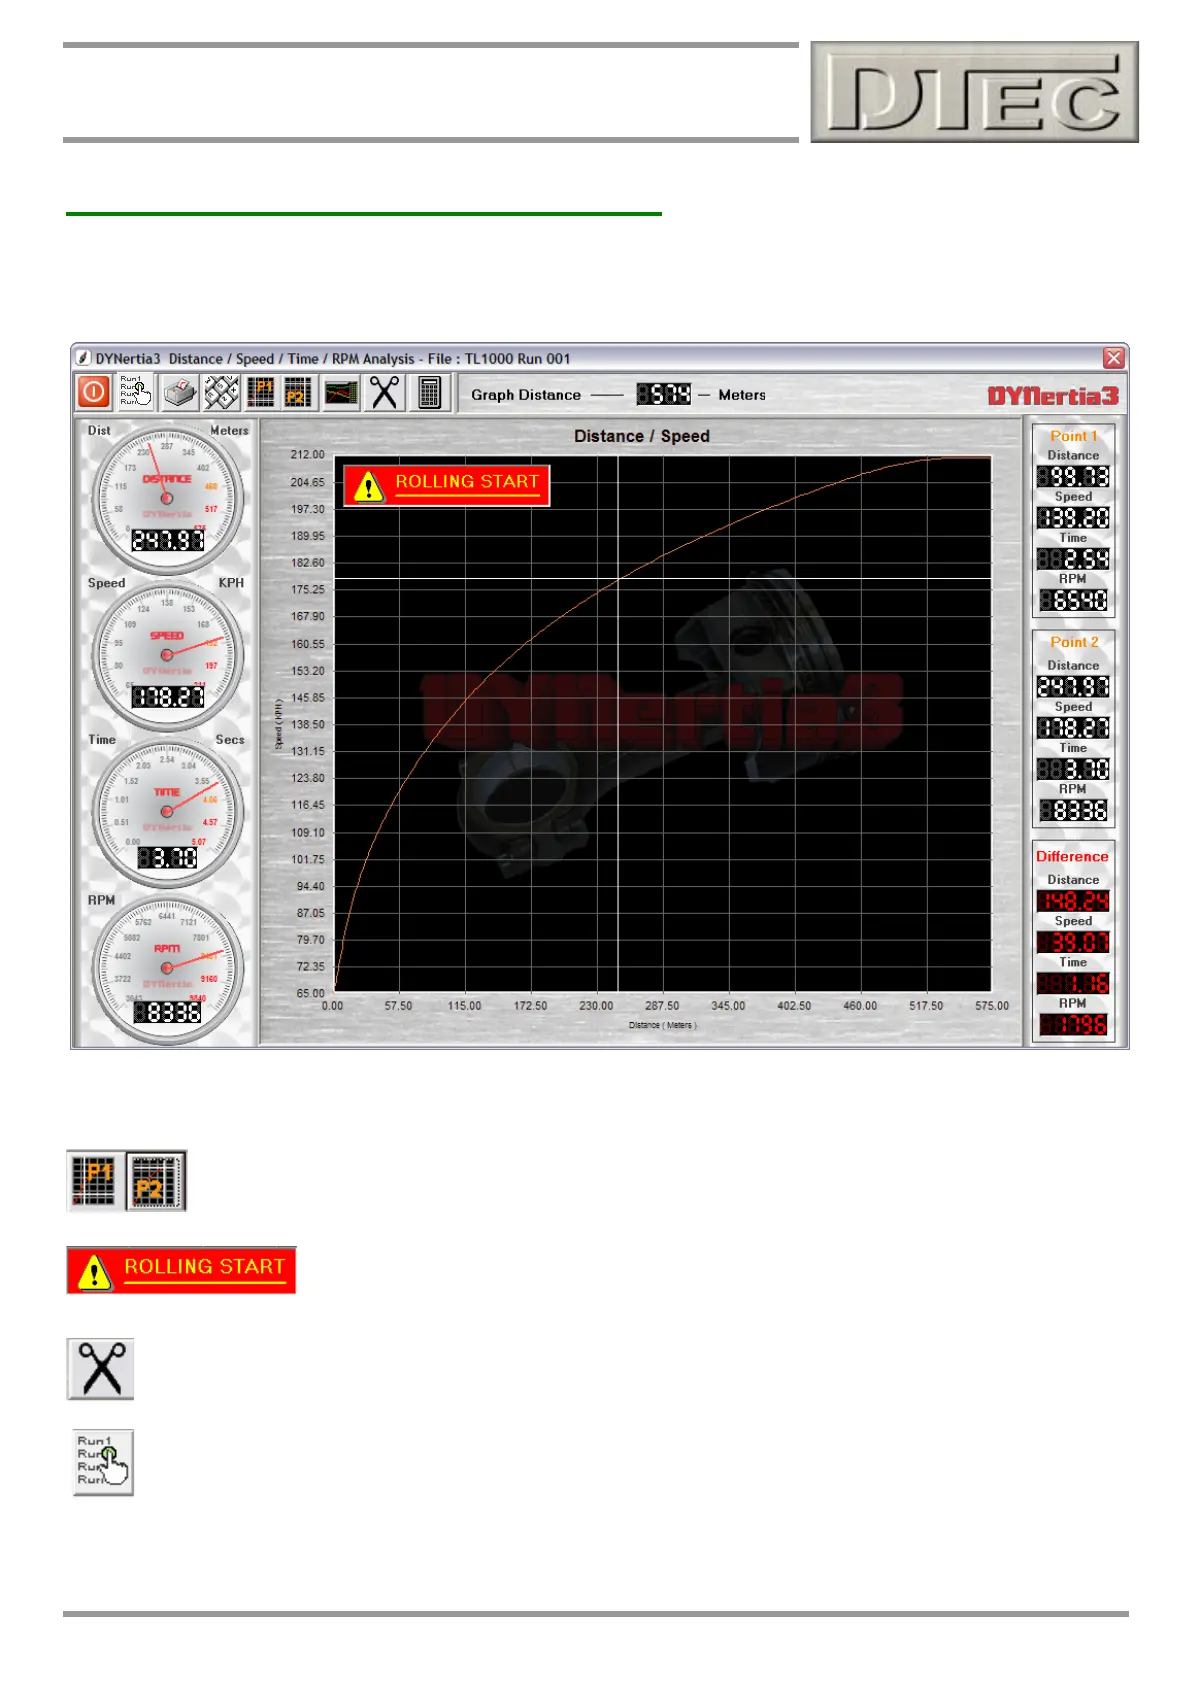
Distance / Speed / Time / RPM Analysis
This Window allows the relationship between these variables to be easily examined. As the test Run is carried out at any
point we can see the distance actually covered by the vehicle (providing we have set up an appropriate tyre
circumference), the current speed, engine RPM and time it has taken to reach this point.
Clicking on the screen brings up a cursor and the data at this point is displayed on the dial gauges.
The cursor can be positioned and “P1” button pressed, move cursor again and press “P2” button, the
data at both points is displayed on the Right hand side along with the difference calculated.
This reminds the user that trace starts at the start of the recorded Run, which is not from
stand still i.e. it represents a rolling start and zero distance is marked at the start of the Run
(in the case above the bike was already travelling at 66KPH at the start)
The graph can be trimmed by manually entering an accumulated distance to end the scale at e.g. in the
example above we could enter a value less than 574 meters if we wished!
Select a Trace to view: Any of the 10 traces loaded into the main Graph Windows can be selected.