www.dtec.net.au
Chapter 13: Analysing Data (‘View’ Menu)
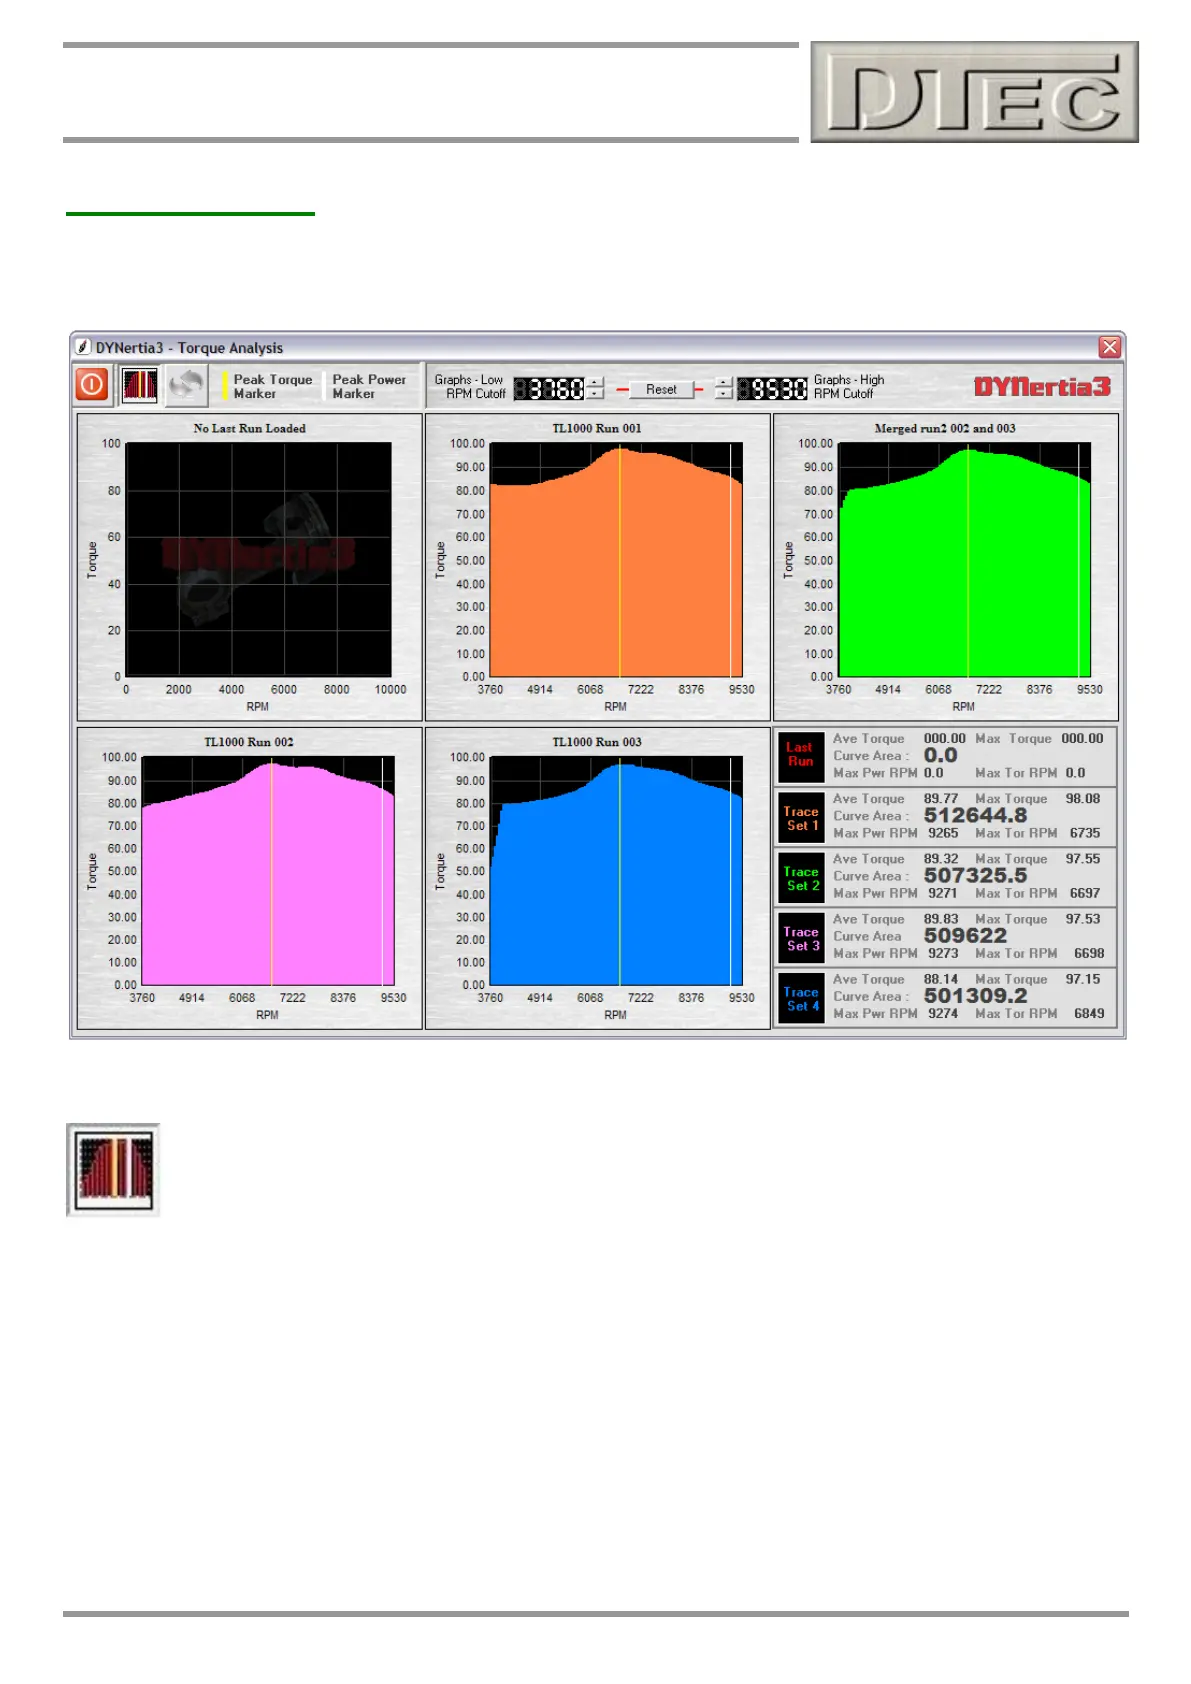
Torque Analysis
A powerful tool that reveals the area under the Torque curve, average Torque, maximum Torque, RPM that developed
maximum Power and Torque.
The RPM points that are calculated between can be easily adjusted in the menu bar. This allows for quickly trimming
down the Runs to compare certain key areas.
The ‘Markers’ button activates markers (vertical lines) on the screens show the peak RPM for maximum
Power and Torque.
Note: The ‘Curve Area’ is a mathematical calculation and has no standard unit of measurement (it is derived from RPM
and Torque data).