www.dtec.net.au
Chapter 13: Analysing Data (‘View’ Menu)
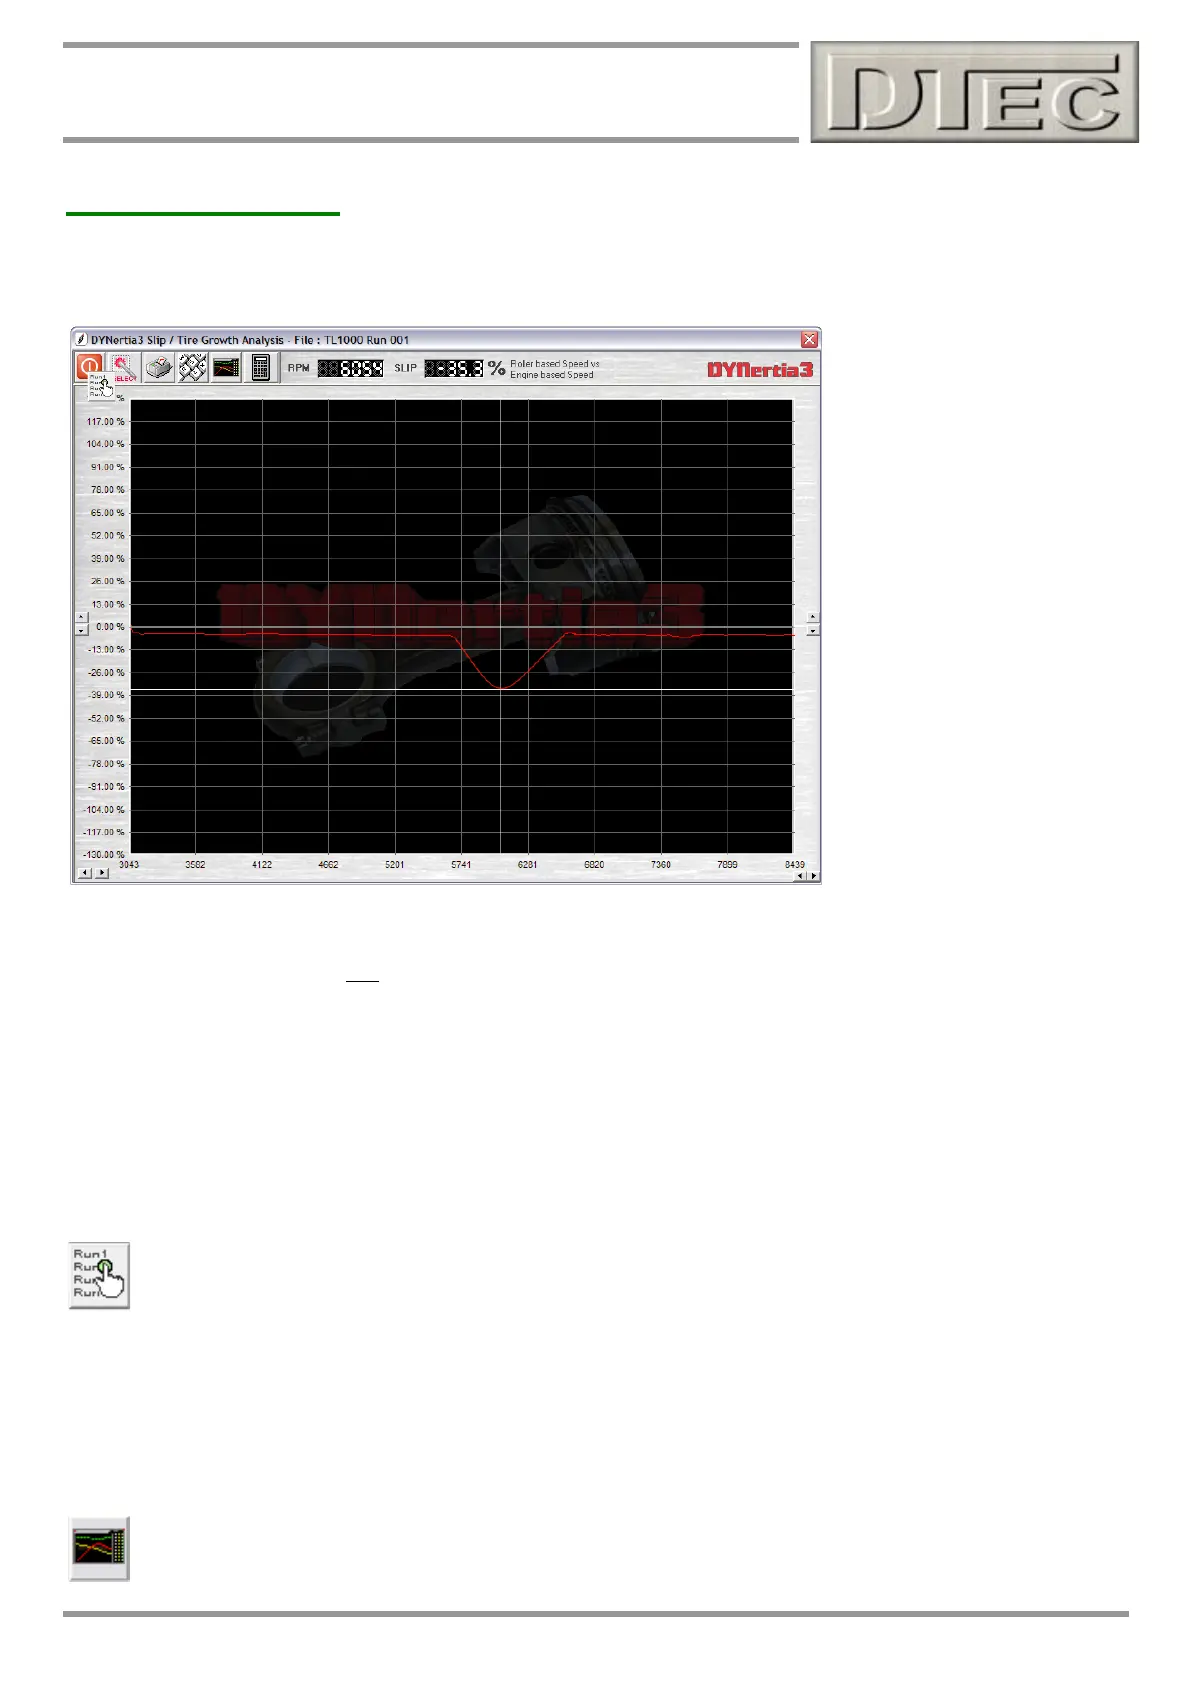
Slip / Tyre Growth
Shows the percentage of difference of a trace’s RPM (measured from DYNertia3’s speed sensor but using the drive ratio
to correct to engine RPM) to that of the secondary RPM source, if used. This Window was designed to show problems
with clutch slip, loss of tyre traction and also the engagement points of centrifugal clutches.
The graph above clearly shows major ‘slip’ at one point, this is due to the engines clutch releasing under power
(certainly explained a dip in the Power curve seen also when testing!)
Note: The ‘RPM Adapter’ input and drive ratios must be setup, it is this ‘RPM adapter’ engine RPM that is compared to
the calculated RPM (from dyno speed and ratio) to measure slip.
Note: ‘Slip’ calculations can’t operate with engines fitted with CVT transmissions or automatics that can’t be locked into
a set gear for testing, this is due to them having a continually changing drive ratio between engine RPM and dyno RPM.
It is normal to see a variation from 0%, there will always be a small amount of slip, particularly on a chassis dyno. There
will also be mathematical ‘rounding’ errors, ignition timing variations and measurement errors (e.g. if your ratio setup is
poor) that can cause a deviation.
Clicking on the screen will reveal a cursor; actual RPM and slip values at that point are shown in the menu bar.‘
Select a Trace to view: Any of the 10 traces loaded into the main Graph Windows can be selected.
“” buttons (lower Left & Right corners) allows the trimming (or ‘zooming in’ ) of the trace image by moving the graph
start and finish points, this can also remove any unwanted trace sections, particularly useful for ensuring the printed
image appears as you wish.
“” buttons (Left ) allows the trimming (or ‘zooming in’ ) of the trace image by altering the graph percentage scales.
“” buttons (Right) allows the offsetting of the trace image by altering the graph percentage scales offset from zero.
Individual Trace view: The trace selected will be shown in the ‘Individual Trace’ screen for a detailed look at
all of the data and what the consequences of the slip may have been at the cursor point.