www.dtec.net.au
Chapter 13: Analysing Data (‘View’ Menu)
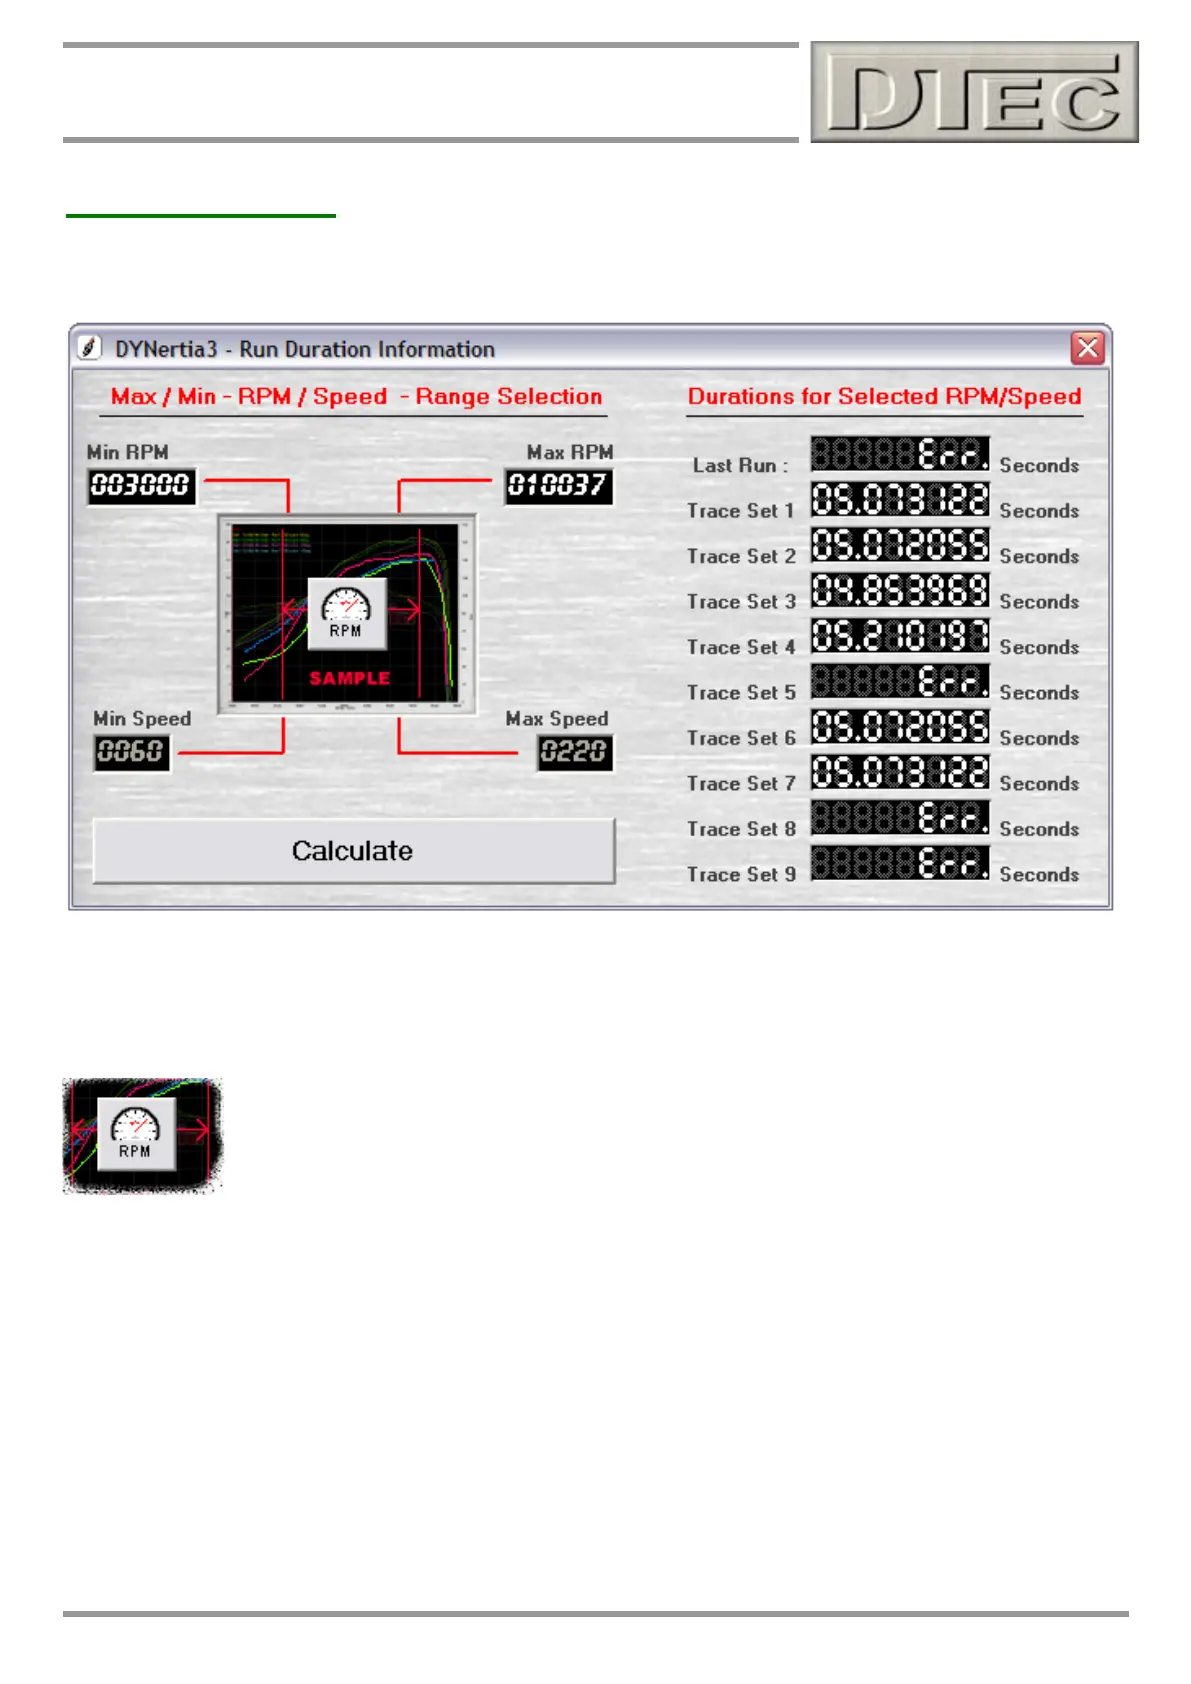
Run Duration Info
Opens a Window that allows the entry of any two speed or RPM points and displays the time between them.
Tip- “Err” displays when there is no selected trace to display i.e. above trace 5,8,9 and last run were not loaded on the
main Graph Window so the data is missing!
Enter any start and finish RPM point or Speed point if you are running in ‘Speed” mode, press “Calculate” to update the
figures.
Select Speed or RPM: Choose the units to time.
Great for showing changes in acceleration rate between tests (i.e. 100 – 200 kph times).
Tip- The two values will initially be selected from the graph scale settings you have chosen (Run start and finish
RPM/speed).