www.dtec.net.au
Chapter 13: Analysing Data (‘View’ Menu)
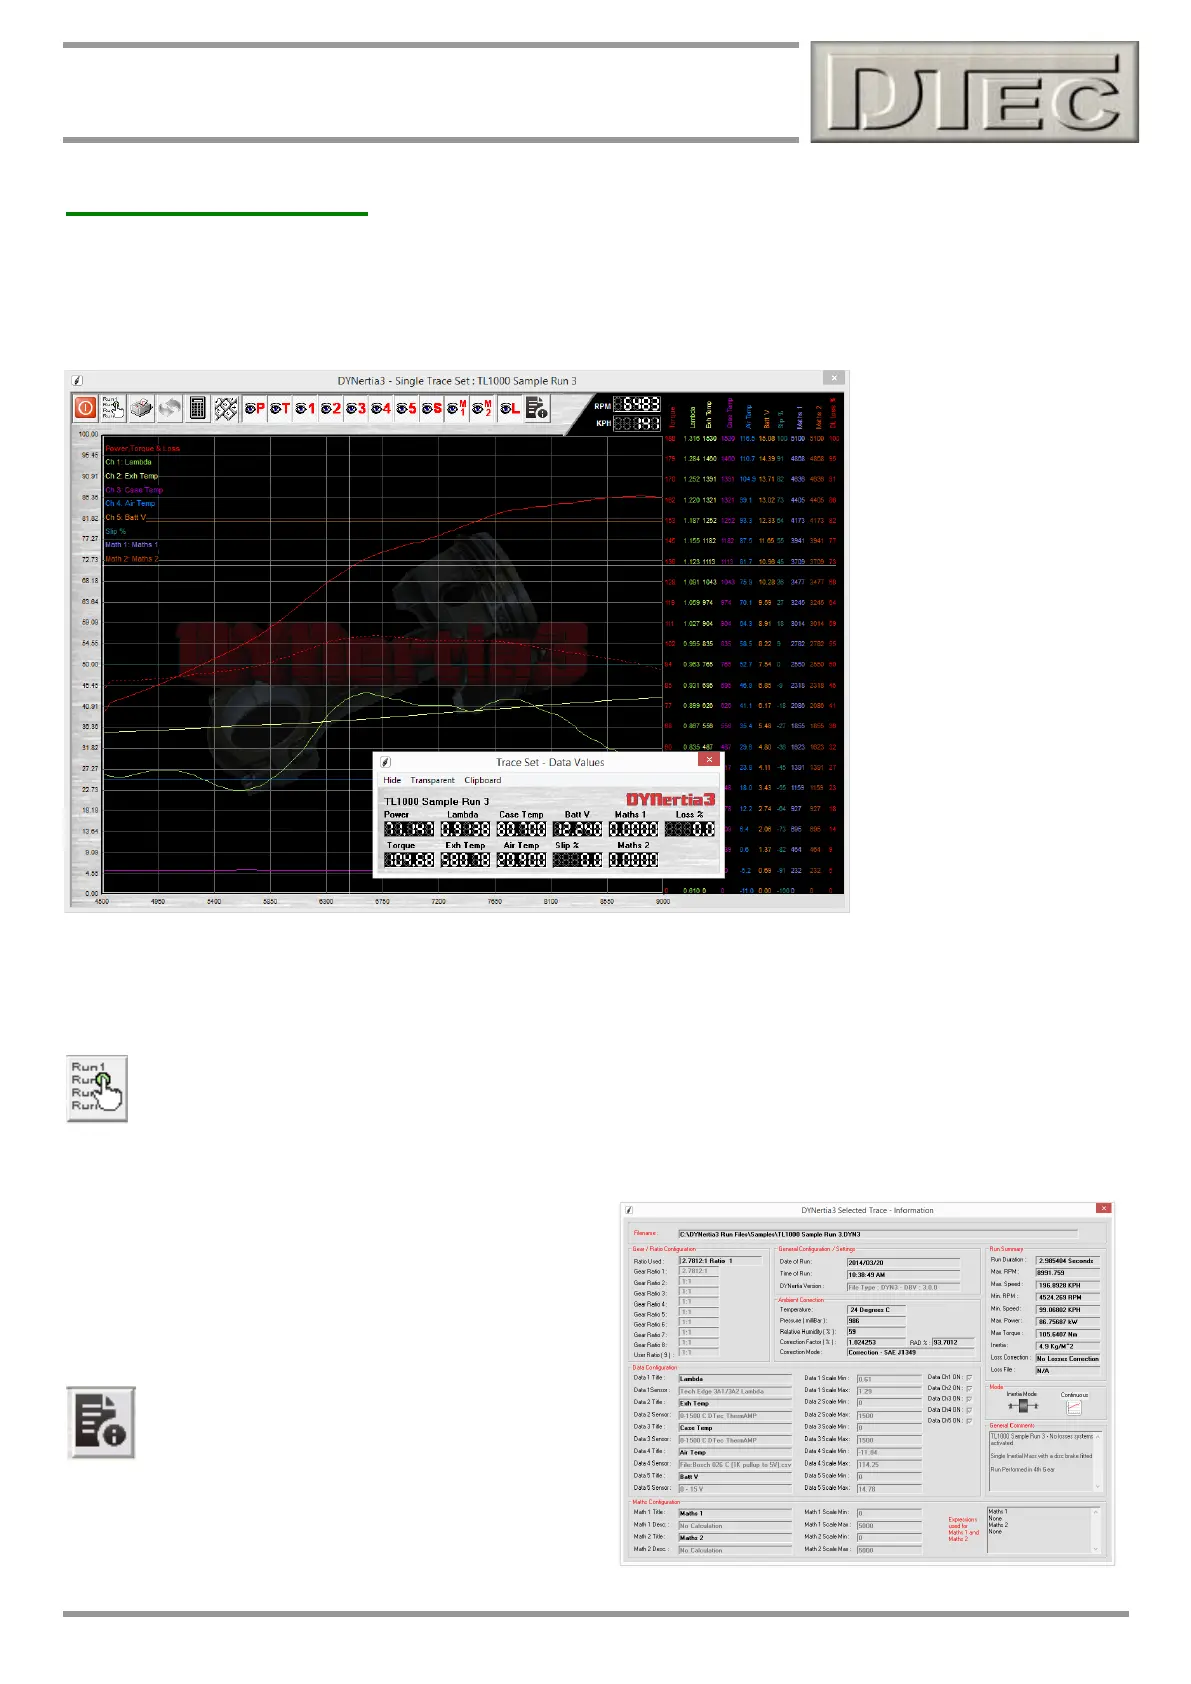
Individual Trace Set
Shows all of the available data for a single chosen Run.
Individual data channels for the chosen Run can be turned on/off (‘eye’ visibility buttons in the menu bar) and the trace
being viewed can be from any of those loaded and selected into the main dyno ‘GRAPH’ screens. Only available Runs
and their active data channels will have the buttons highlighted for operation!
‘Floating’ data value box is
activated by a ‘Click’ in the
Right hand scale margin to
turn on/off. Cursors are used
to help analyse the
information, position the
mouse and ‘Click’ on the
graph. The cursor can also
be ‘Dragged’ by holding the
mouse button down whilst
moving over the graph.
Tip- The data value box’s
transparency level can be
adjusted in the menu option
“Setup/Software” so that it
does not obscure the view
behind it. The box can be
freely dragged by its border
to any screen position (‘Click
and drag’ the box’s edge).
Clipboard menu allows you to ‘paste’ the data displayed in the data box onto the Windows ‘clipboard’, this means you
can paste it into any text program you like, such as Word or Notepad. Ideal if you want a permanent record of all the
data that is displayed at the cursor location on the graph. Along with the data are copied details of the displayed traces.
Scale on Left side is power (as all other units are on Right axis).
Select a Trace to view: Any of the 10 traces loaded into the main GRAPH Window can be selected.
Tip- The cursors horizontal bar can be used as a guide to read of values from the Left axis if required (if ‘floating box’ is
not being used for example)
Tip- The RPM scale is taken from the main graph screen,
so trimming the main graph (e.g. using the corner arrows)
will vary what is seen in this screen.
Information: This button will reveal a summary
table (Trace Info) of the data associated with the
trace set currently being viewed.