www.dtec.net.au
Chapter 9: Trim, Merge & Join runs
Join Runs
Multiple ‘Point by Point’ tests can be ‘joined’ together to form a new ’combined’ test. This
function is particularly useful when multiple data sets have been recorded in certain RPM
ranges and you wish to combine all of the data into a single common set. Many testers do
small lots of testing at particular points of interest, joining compliments this practice perfectly.
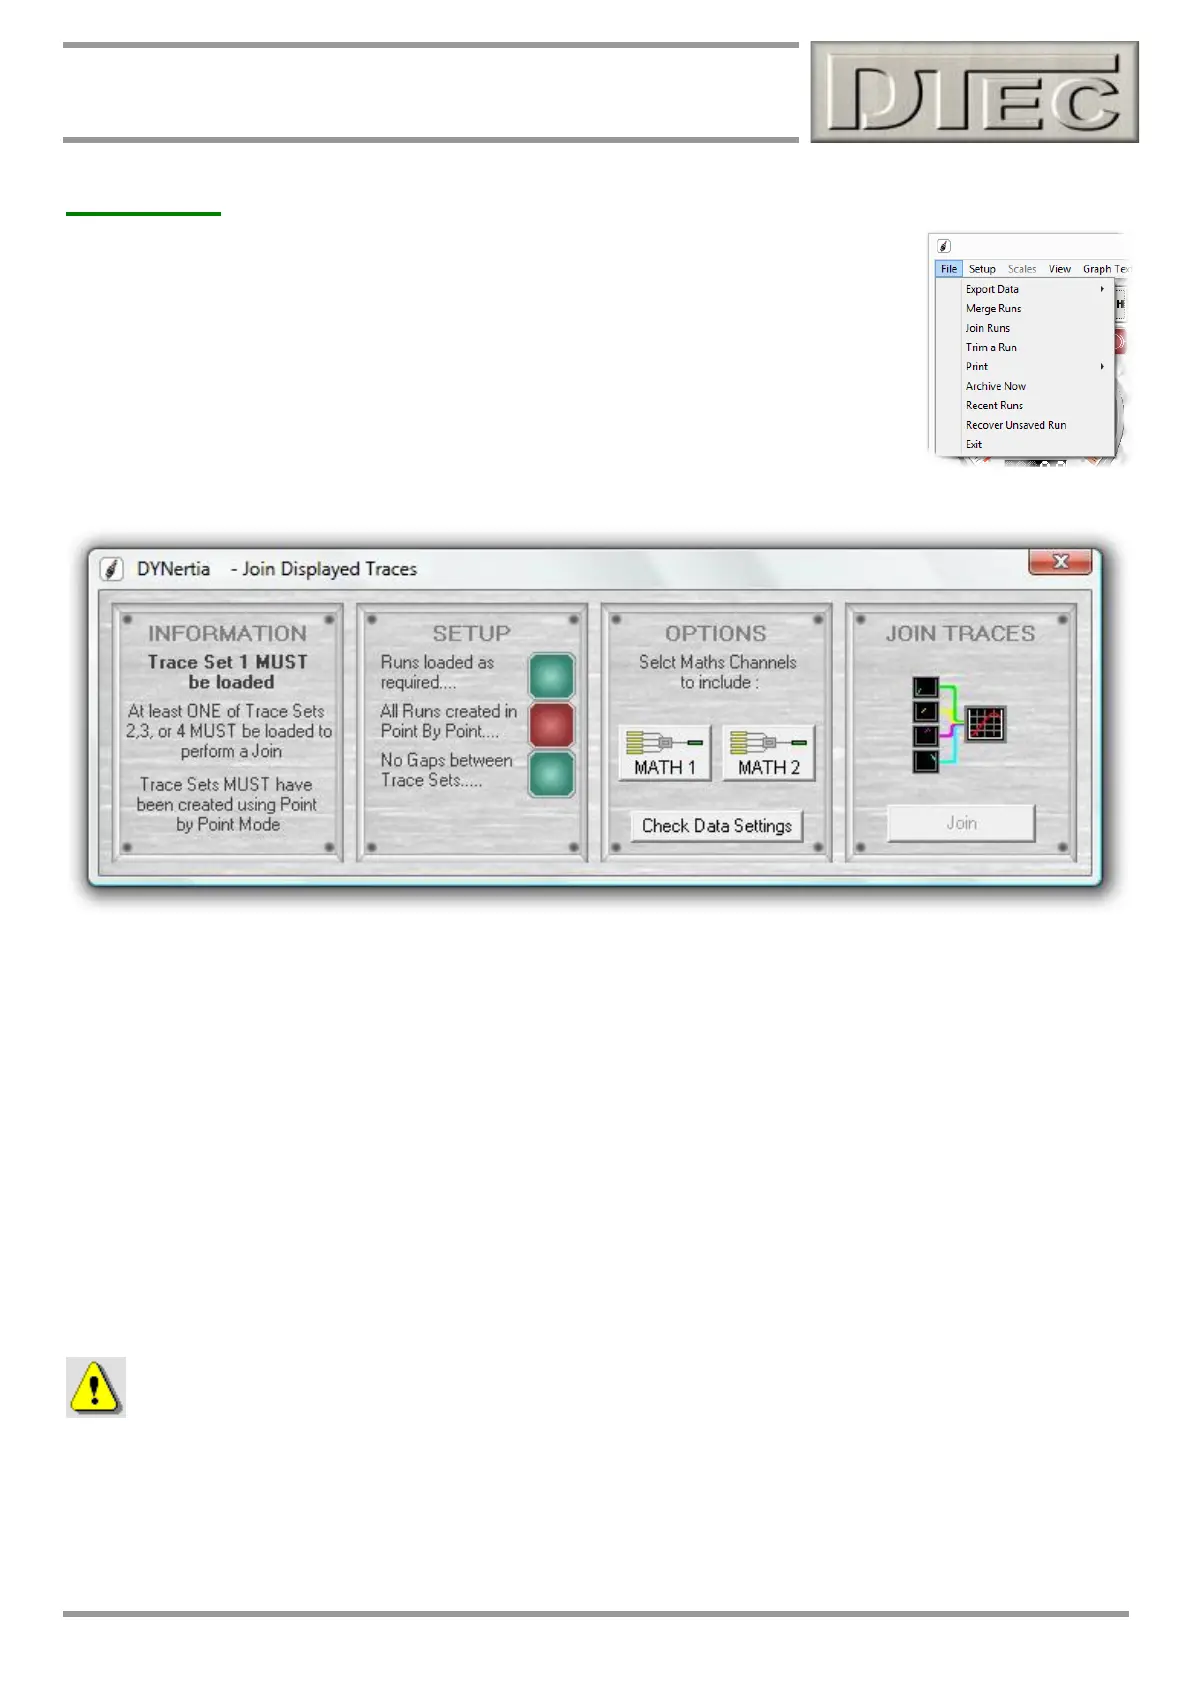
A ‘joined’ Run will be based on up to 4 visible traces (2, 3, or 4). It is required that trace set “1”
be loaded and visible as this is used as the ‘master’ when DYNertia3 generates the new data
(any of your recorded comments will copy from this to the new file). The files merged will be all
of the ones visible on the Graph Window. The new trace will be loaded as the ‘last run’ trace
automatically. After the new joined Run is created you will be asked if you want to hide the
other graph Runs so only the new one remains visible.
Tip- The menu option “View/Clear Graphs” (or ‘Delete’) can be used to clear all of the graph traces so you can pick
entirely new ones to join if you wish.
Note: Only ‘Point by Point’ Runs (those done in brake mode by storing individual data sets) can be joined. The screen
image above shows a red indicator that one of the traces was not ‘Point by Point’!
The new ‘joined’ Run will appear as a complete data file and is treated just like any other run. The General comments
field of the new files notes will automatically have appended a list of the files that it was generated from.
If there are ‘gaps’ between the data sets you will be warned, but joining will still continue. This is to let you know that the
data doesn’t overlap e.g. there may be a big gap between RPM finish of one trace and RPM start of another, therefore
the trace may have a ‘Hole’ in the data.
When joining data sets with overlap of RPM points (as is best to avoid ‘gaps’) precedence is given to the lowest
numbered trace e.g. if 1 and 2 are joined the overlapping points from 2 will be disregarded.
There are different methods used to indicate that a file is the result of joining multiple data sets, depending on the
screen-
An “!” symbol will appear next to the run when a ‘graph summary’ is viewed and ‘File explorer’ has a note on top
of the preview graph.
For indication purposes the weather correction data from the chosen Runs is also averaged into the new weather fields
as is the actual correction figure generated by them.
Tip- It is not suggested to merge runs that have been performed under different weather correction standards i.e. don’t
merge SAEJ607 runs with DIN 70020 etc. as the result will be meaningless for analysis, as will be the result if the
original runs vary greatly from each other.