www.dtec.net.au
Chapter 8: Loading / Viewing Files
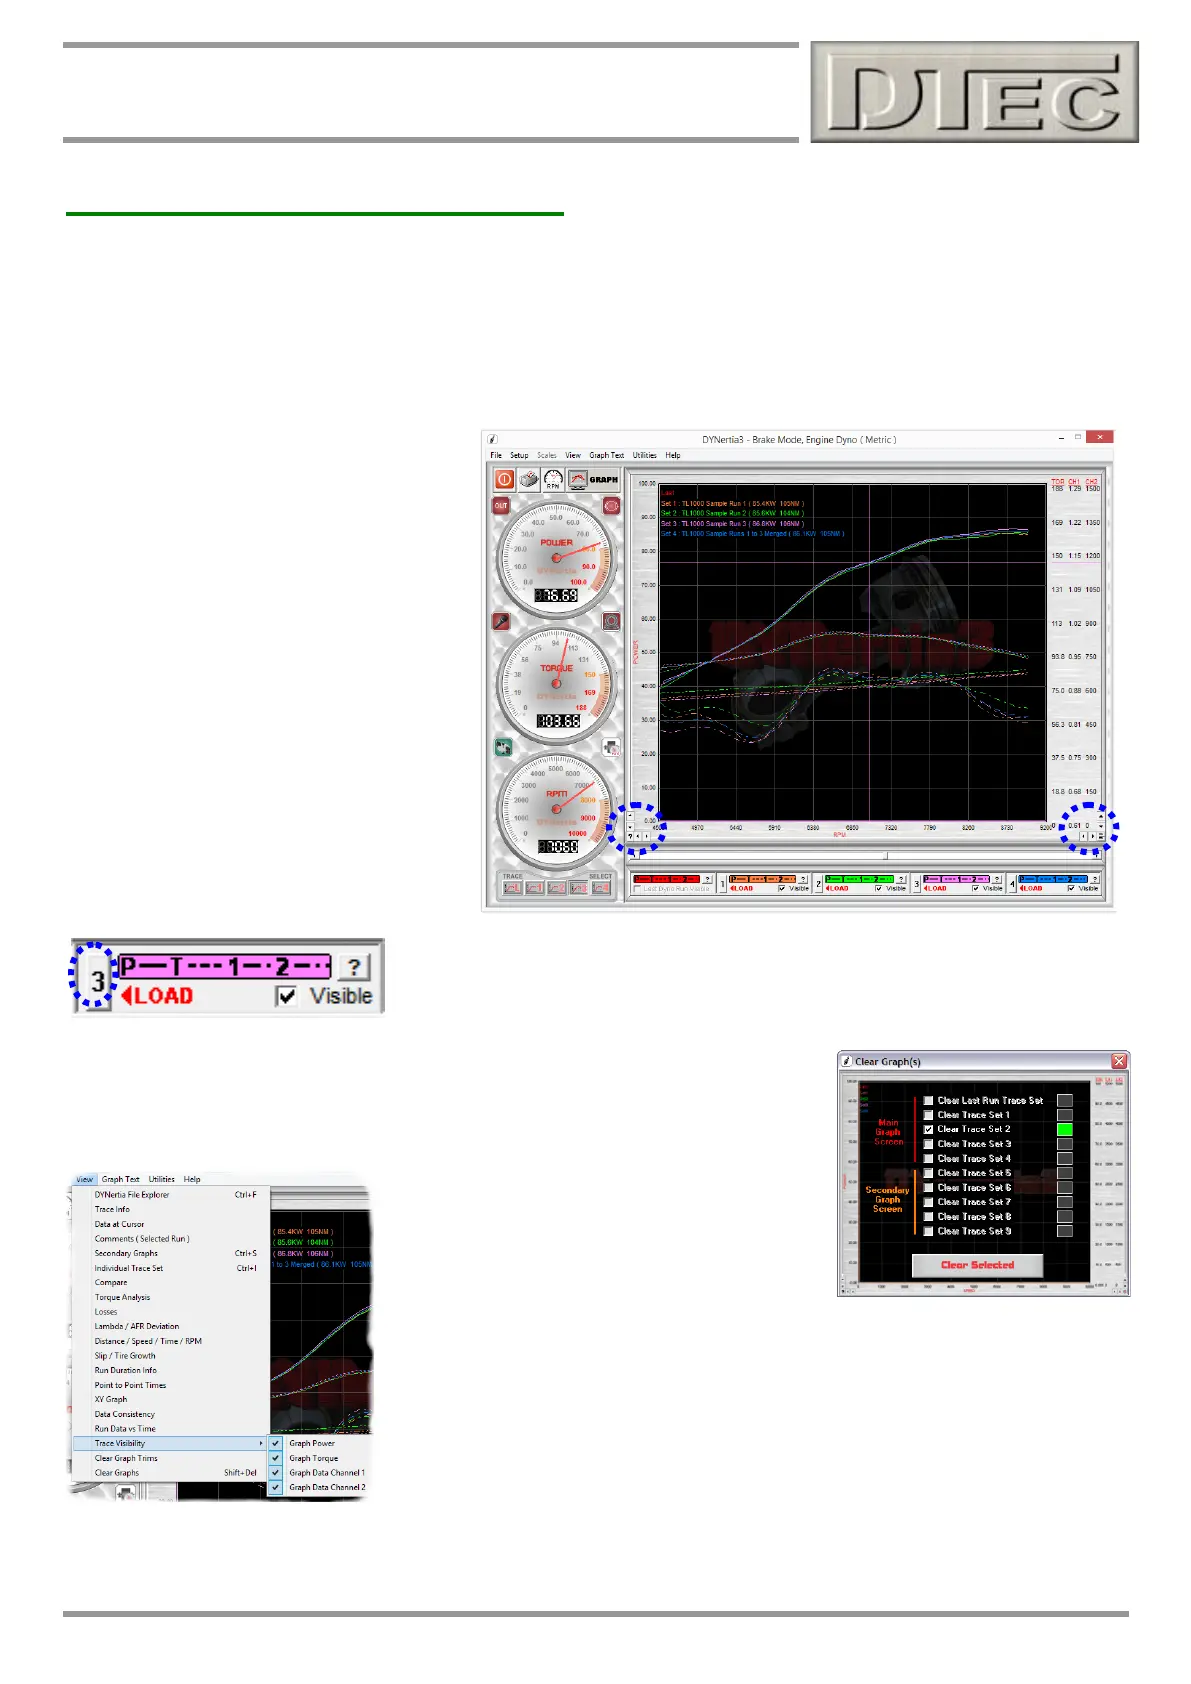
Viewing Files (‘GRAPH’ Window)
Adjusting Graph appearance
The main GRAPH Window is convenient for quickly comparing runs and is a powerful analysis tool in its own right!
Note: Refer to manual section “Overview- 2 Main Screens” for information on GRAPH screen controls.
Note: Also refer to manual section “Trim, Join & Merge Runs” for important information on manipulating traces!
Zooming
The scales are automatically set of the
highest data values. To ‘zoom’ in or ‘trim’
the graph use the “” buttons in the
lower graph corners.
Clear Graph Trims
Menu “View/Clear Graph Trims” clears all of
the manual adjustments (Zoom) made to
the graph scales and returns to the
automatic scale selection.
Tip- There is a menu option “File/Trim a
Run” that creates and saves a new file
using whatever start and stop RPM points
you choose. This is good to permanently
remove any unwanted sections of a trace
that may occur due to poor setting of the
‘Run Minimum & Maximum’ speeds!
Traces to view and analyse are ‘loaded’ onto the GRAPH screen by using the
coloured boxes beneath the graph. Un-checking a traces Check Box will hide it
from view, it does not remove it. Check it and it becomes visible again. Handy
when the graph screen is getting cluttered or for printing only selected traces.
Clear Graph
To remove traces off the screen (un-load them) press your keyboards ‘Shift’ and
‘Delete’ button (or menu option “View/Clear Graph”). Files are not harmed; they are
just not selected for viewing
Trace Visibility
Individual data can be removed from view on
the graph using the “View/Trace Visibility’ menu.
Grid
Found in menu “Setup/Grid”, allows the grid lines to be removed from the graph,
this effects printing also as what is on the screen is what is printed.
Tip- ‘The export functions found under the ‘File’ menu also give you the freedom to export to Microsoft’s ‘Excel’, this
opens up infinite possibilities to graph and analyse the data as required.