www.dtec.net.au
Chapter 4: ‘Setup’ Menu Options
Software- Setup Menu (cont.)
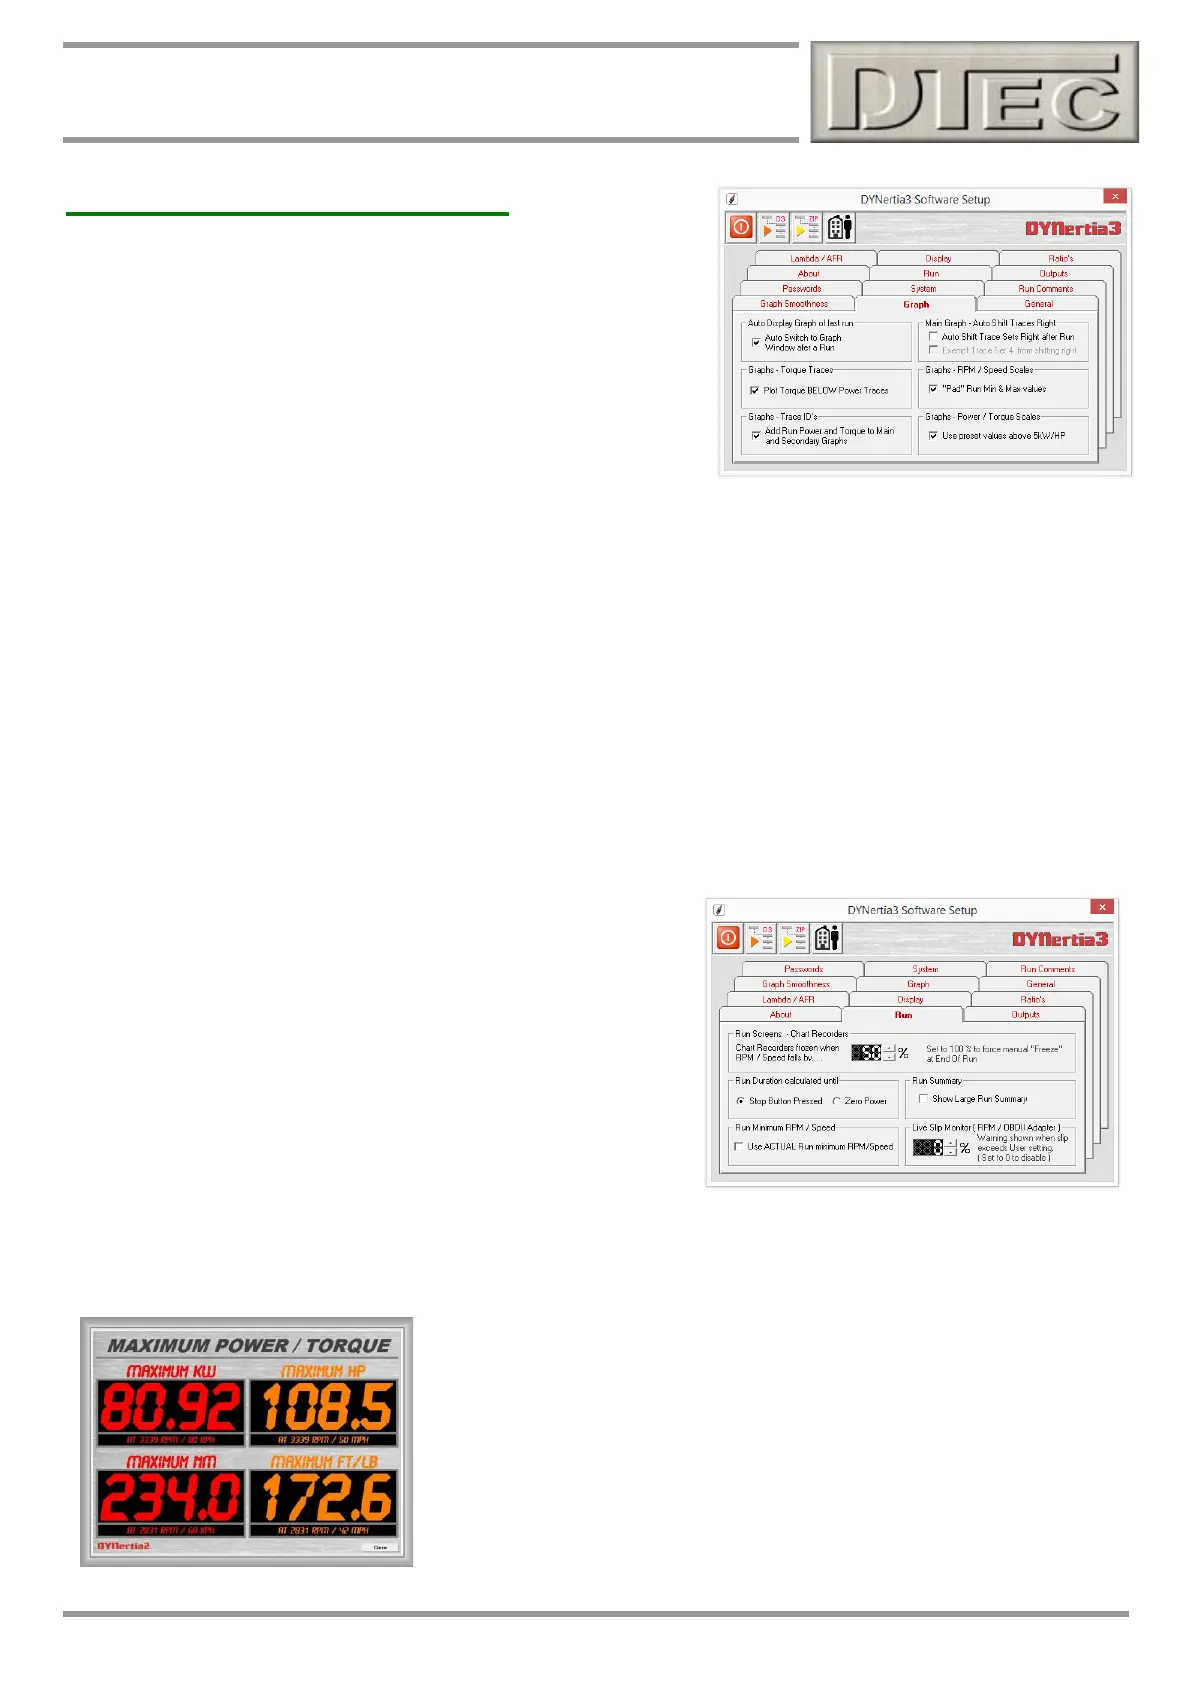
Graph
Auto Display of Last Run: When selected, DYNertia3 will
automatically open the Graph Window and add the test Run just
performed to the set of traces so you can view it immediately.
Tip- If testing many times before analysing traces then it’s faster with
this function off!
Graph Torque Traces: The axis of the graph are automatically scaled,
if you prefer the torque traces to sit below the power traces then select (graph scales can still be altered manually and
override this setting). Feature is just a visual preference, traditional dyno graphs have the torque scaled lower when
displayed.
Graph Trace ID’s: Appends the min and max power to the test run names (visible on Main and Secondary graphs).
Auto Shift Traces Right: Setting ‘Auto Shift’ means that each time a new ‘Run’ is performed that it’s loaded as the
‘last run trace’ and the previous last Run becomes trace number 1, trace 1 moves to trace 2, 2 moves to 3, 3 moves to 4
and 4 is removed from selection. This feature allows for the graph to always contain the latest Runs.
There is the additional option to leave trace set 4 as a reference trace. You can choose to ‘Exempt Trace Set 4’. This
means that trace 4 will remain as loaded and not be shifted off the screen.
RPM / Speed Scales: If the data gathered is slightly above/ below the start or end graph range it will be interpolated for
better graph appearance.
Power / Torque Scales: The axis of the graph are automatically scaled, the units used are ‘neat’ increments (e.g.
90Kw, 100Kw etc). If you are testing very small power engines then it may make analysis easier if fractional scales are
used (e.g. 4.34Kw, 5.5Kw etc)
Run
Run Screens – Chart Reorders: Determines after a test when the
chart recorder data is frozen to allow viewing.
Run Duration Calculated until: Run time duration displayed in the
data will start at the press of the “start run” button (or F12) and end at
these two options, either ‘stop’ pressed (or F12) or zero Power
detected.
Use Actual run Min RPM: The trace will use the actual minimum
RPM seen, and not the start RPM as set on the “DYNO’ screen in the ‘Record Settings’ field.
Tip- Normally leave this un-ticked for a better looking Run trace, avoids having irrelevant data on the graph i.e. RPM
showing that is even below when the actual test began
Run Summary: Selecting “large Summary” will produce a large summary
screen showing both imperial and metric data after a Run. Screen is designed
for use in public displays such as ‘dyno competitions’.
Live Slip Monitor: Warning when chassis dyno slip (measured engine RPM
vs RPM calculated from roller) exceeds difference.