www.dtec.net.au
Chapter 14: Inputs- Using
Getting the best data
Calibrating an individual sensor is the ideal way to get the best data. Every sensor has some tolerance (surprising large
for many) and even DYNertia3 will have some variance in input impedance.
By directly noting the ‘raw’ mV reading and using this as for your data you are compensating for most of the variables
that effect accuracy. You may notice the 0-15V range in the sensor list has actually 5000mV= “14.78”V and not 15.00V,
this is as the 15V range switch does not exactly divide by 3. This is a good example of improving accuracy by calibration.
Tip- The 0-5V range selection will give the highest performance as the resolution is greater, as is the input impedance.
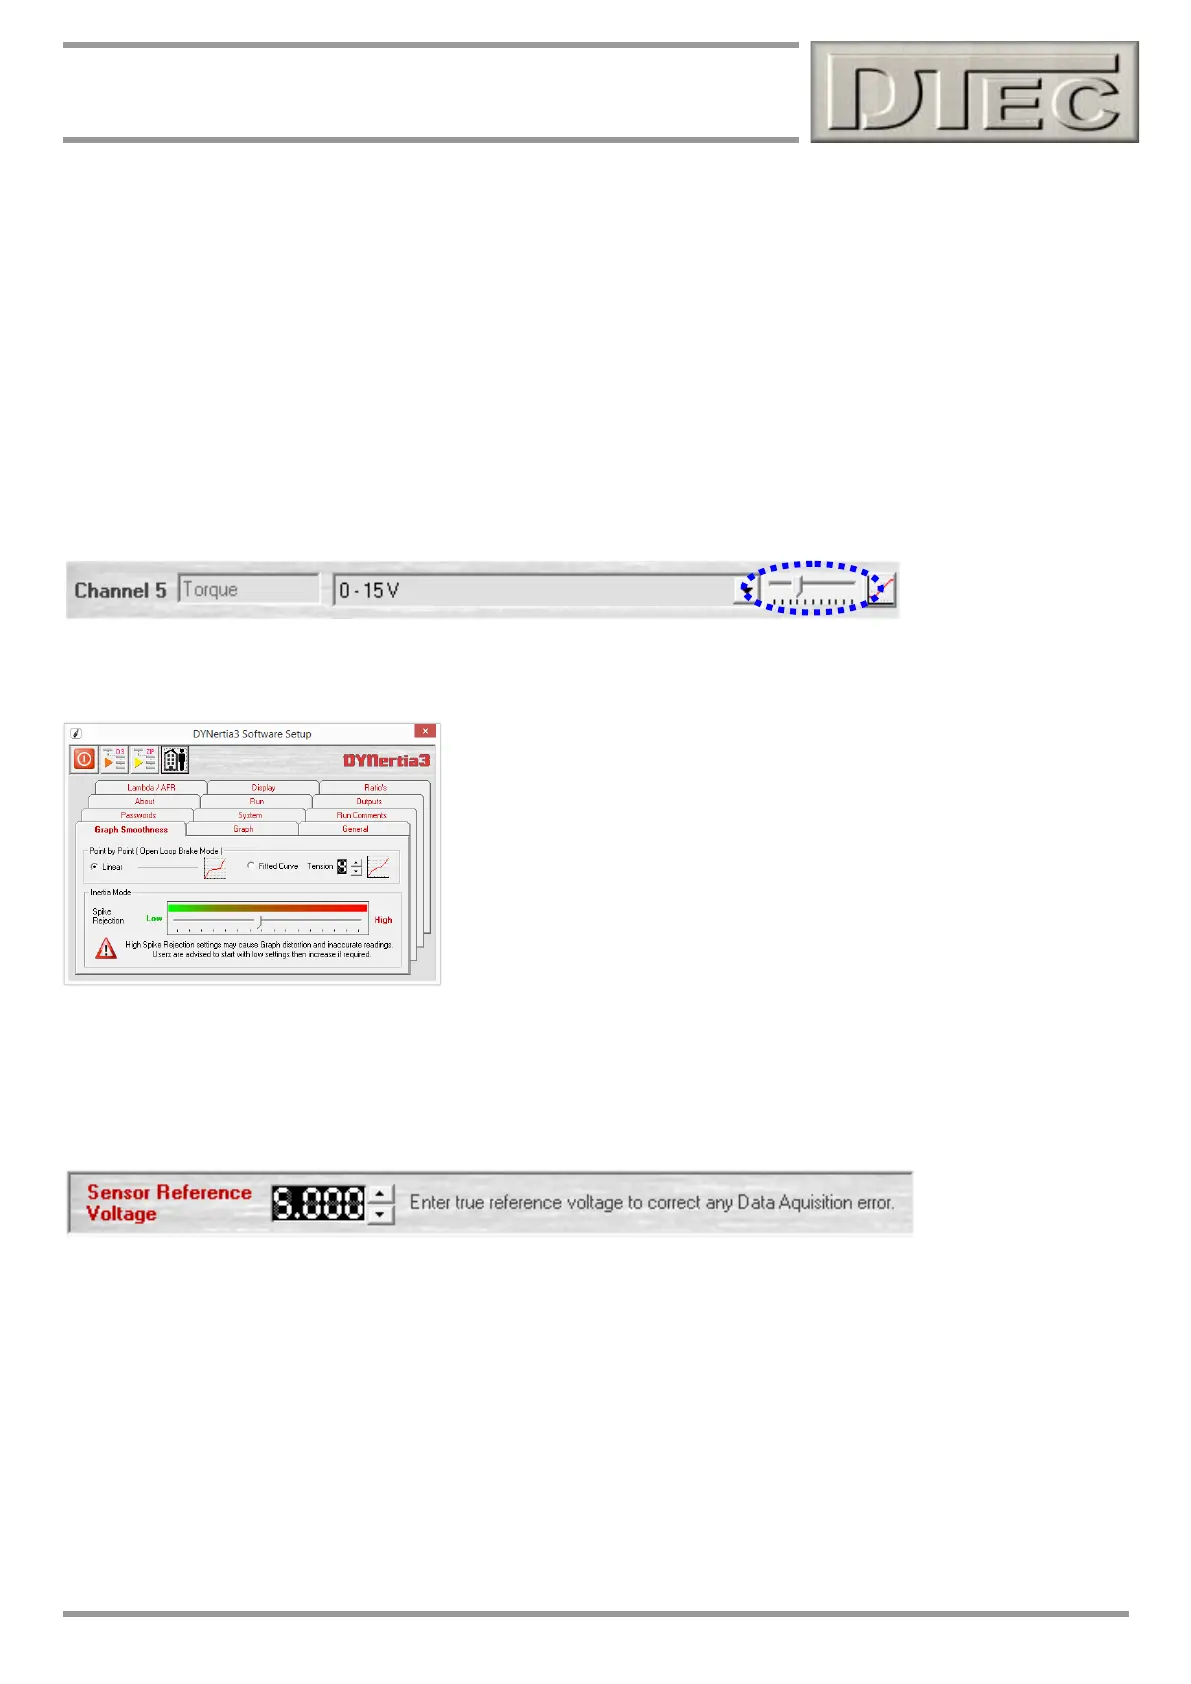
Channel Filtering: Each channel has its own filtering setting. Excessive filtering should be avoided as it can hide data
that may be of interest. Only use what is required for sufficiently smooth graphs/displays!
This is particularly important for Channel 5 as a load cell may be connected here. This has a major effect on the
appearance of the graphs in brake dyno mode.
Tip- Filtering of the main graph, not the individual channels as discussed
here, is done in menu option “Setup/Software/Graph Smoothness”
Only use what is needed to create suitable graphs, set correctly it will filter
out some of the ‘spikes’ discussed here. It cannot make up for poor data
from sensor faults and large amounts of interference.
Reference Voltage Correction: A tiny voltage error may be present in DYNertia3’s internal 5 Volt supply, this option is
available to correct for this variation. This adjustment is rarely required as the 5 Volt is very precise. Simply measure the
voltage between the ground and 5V output terminals on the data acquisition connector and enter the measured voltage.
Tip- This voltage can be also used to correct for sensor errors (if applicable to all channels), but this is really best done
by modifying the sensor configuration table to 'trim' the result.