www.dtec.net.au
Chapter 12: Live Data Viewing
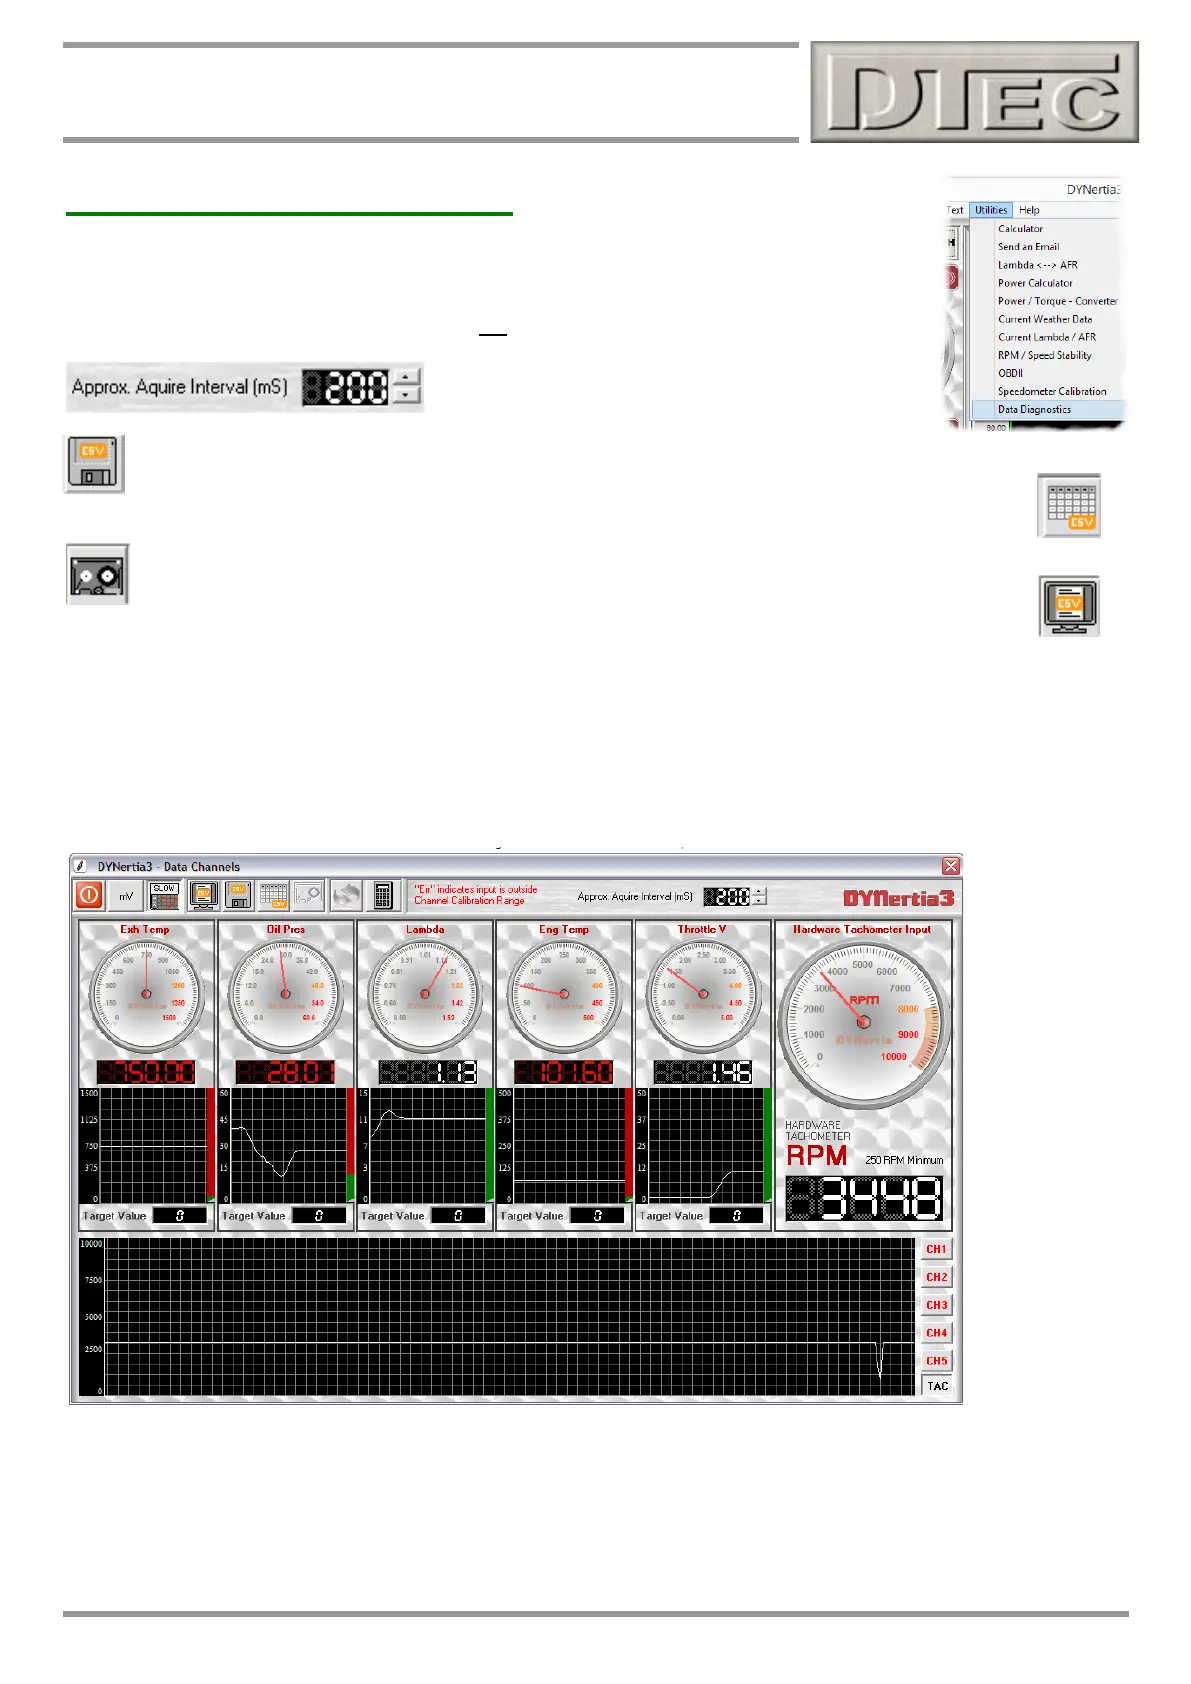
Observing the Data Channels
The ‘Data Channel’ viewing and logging Window should not be overlooked for viewing live data
in certain cases, though generally it is designed for sensor configuration and calibration.
Note: Window is found in the menu “Utilities”, not these Gauges selections.
Data logging to the PC is also available and data is
continually written (CSV format) at the intervals set.
To record (log) data a file must be first named by pressing the ‘Disc’ icon.
You can choose to save ‘header’ names to the columns of logged data.
Logging data is started by this button.
Log files can be easily previewed with this ‘Monitor’ button.
The data shown can be in the actual units calibrated for the channels (i.e. channel 1 may be calibrated to show Lambda
from a lambda meter), optionally by pressing the “In mV” button the 'raw' mV readings measured are displayed, this is
prior to any sensor calibration being applied.
A red "Err" reading means the input voltage or RPM is outside the input range (0 - 5000mV or less than 250RPM) or if a
sensor alarm/limit is applied.
Note: Torque is automatically selected for channel 5 if you are in ‘Brake’ mode (only channel used for a load cell!)
Tip- This screen is ideal for calibrating sensors as you can use the “In mV” button to display the 'raw' mV readings (0-
5000mV).
Note: DYnertia3 internally reads mV from 0-5000, If you select a switch setting of 0-15V range you are dividing the
input by 3 before it is measured. The ‘raw’ values will be still in the 0-5000 range eg. 9V input would be 3000mV raw.