5 Quality Control
301-7146 English Rev B 11/02/2011 Operator’s Manual NA 101
QC Definitions
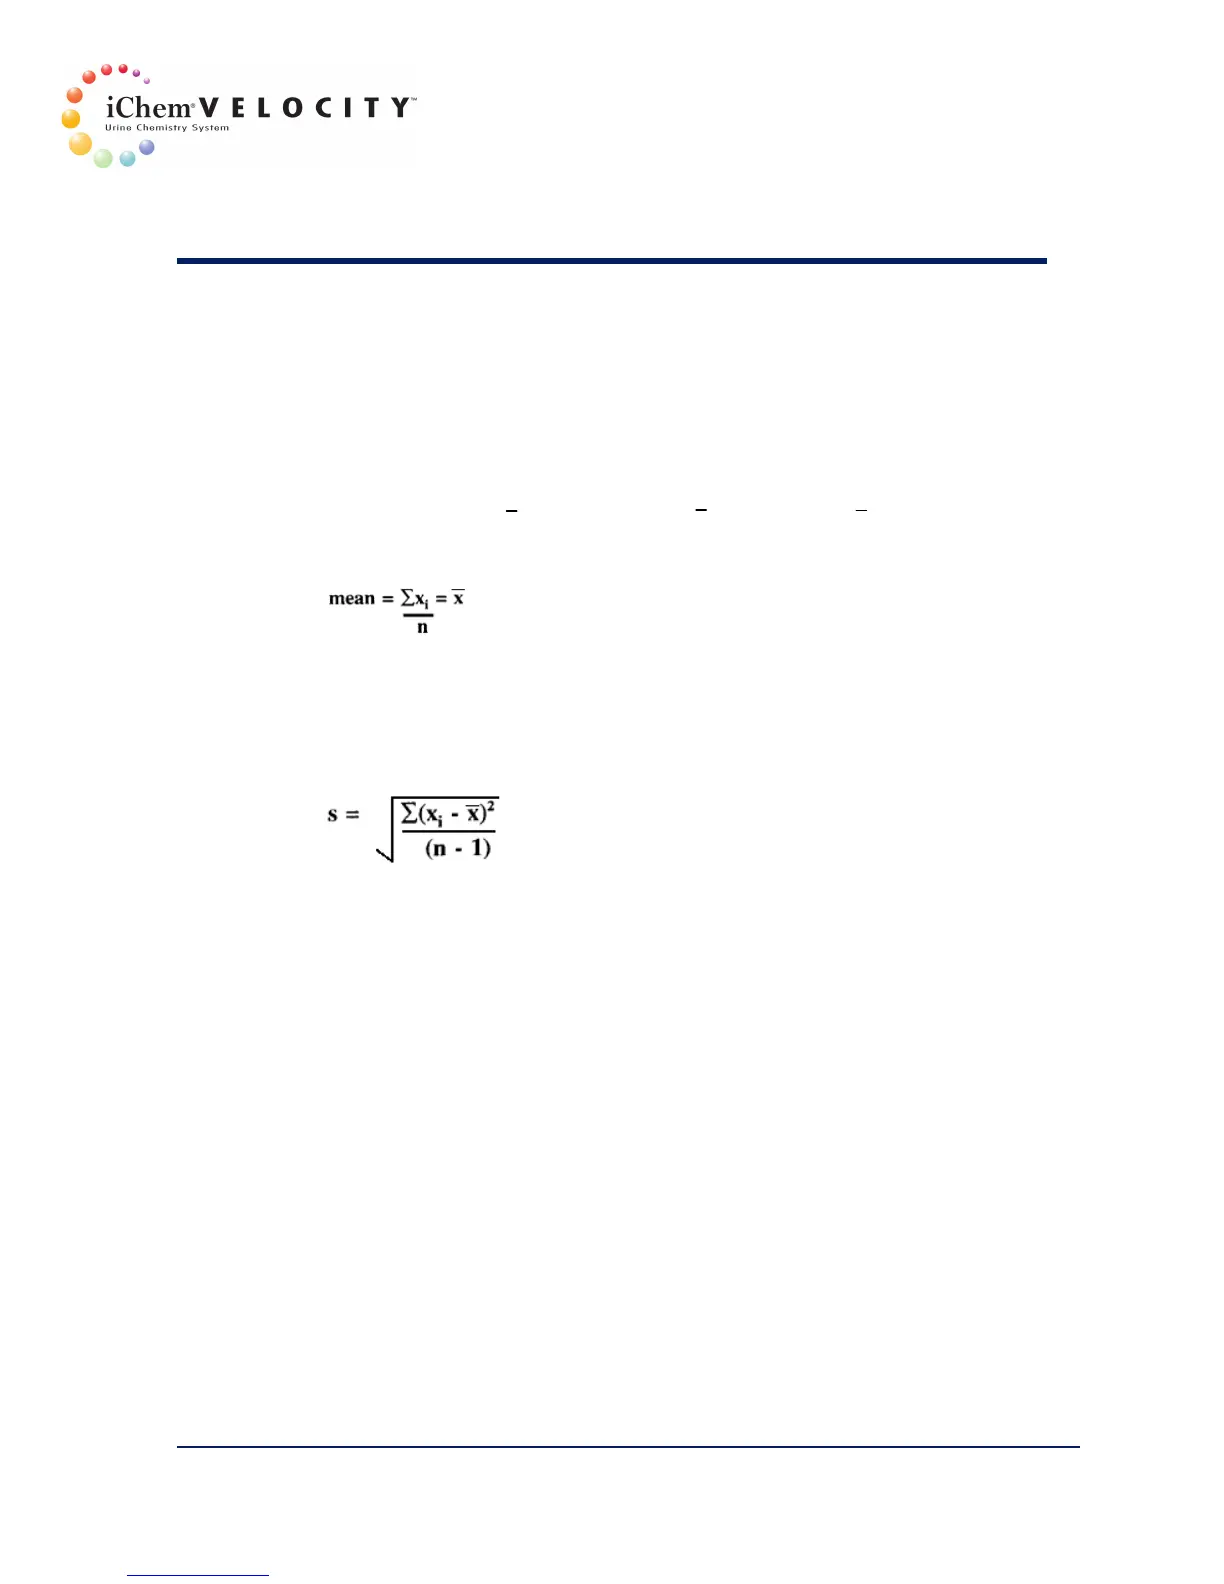
Mean
The arithmetic average of a set of values. A measure of central tendency
of the distribution of a set of replicate results. Often abbreviated by an x
with a bar over it: x. In this usage, x is the running mean of the points on
the graph.
Standard Deviation
A statistic that describes the dispersion or spread of a set of
measurements. Calculated from the equation:
where n is the number of measurements, and x
i
is an individual
measurement.
Coefficient of Variation
The normalized standard deviation; i.e., the standard deviation expressed
as a percentage of the mean.
CV = (SD / mean) * 100 (%)
Levey-Jennings Graph
A commonly used control chart in which individual control measurements
are plotted directly on a control chart with limit lines drawn either as mean
± 2SD or mean ± 3SD. Time is displayed on the x-axis usually in terms of
days or runs.
Target Value
The bottle value of the specific lot.