5 Quality Control
301-7146 English Rev B 11/02/2011 Operator’s Manual NA 99
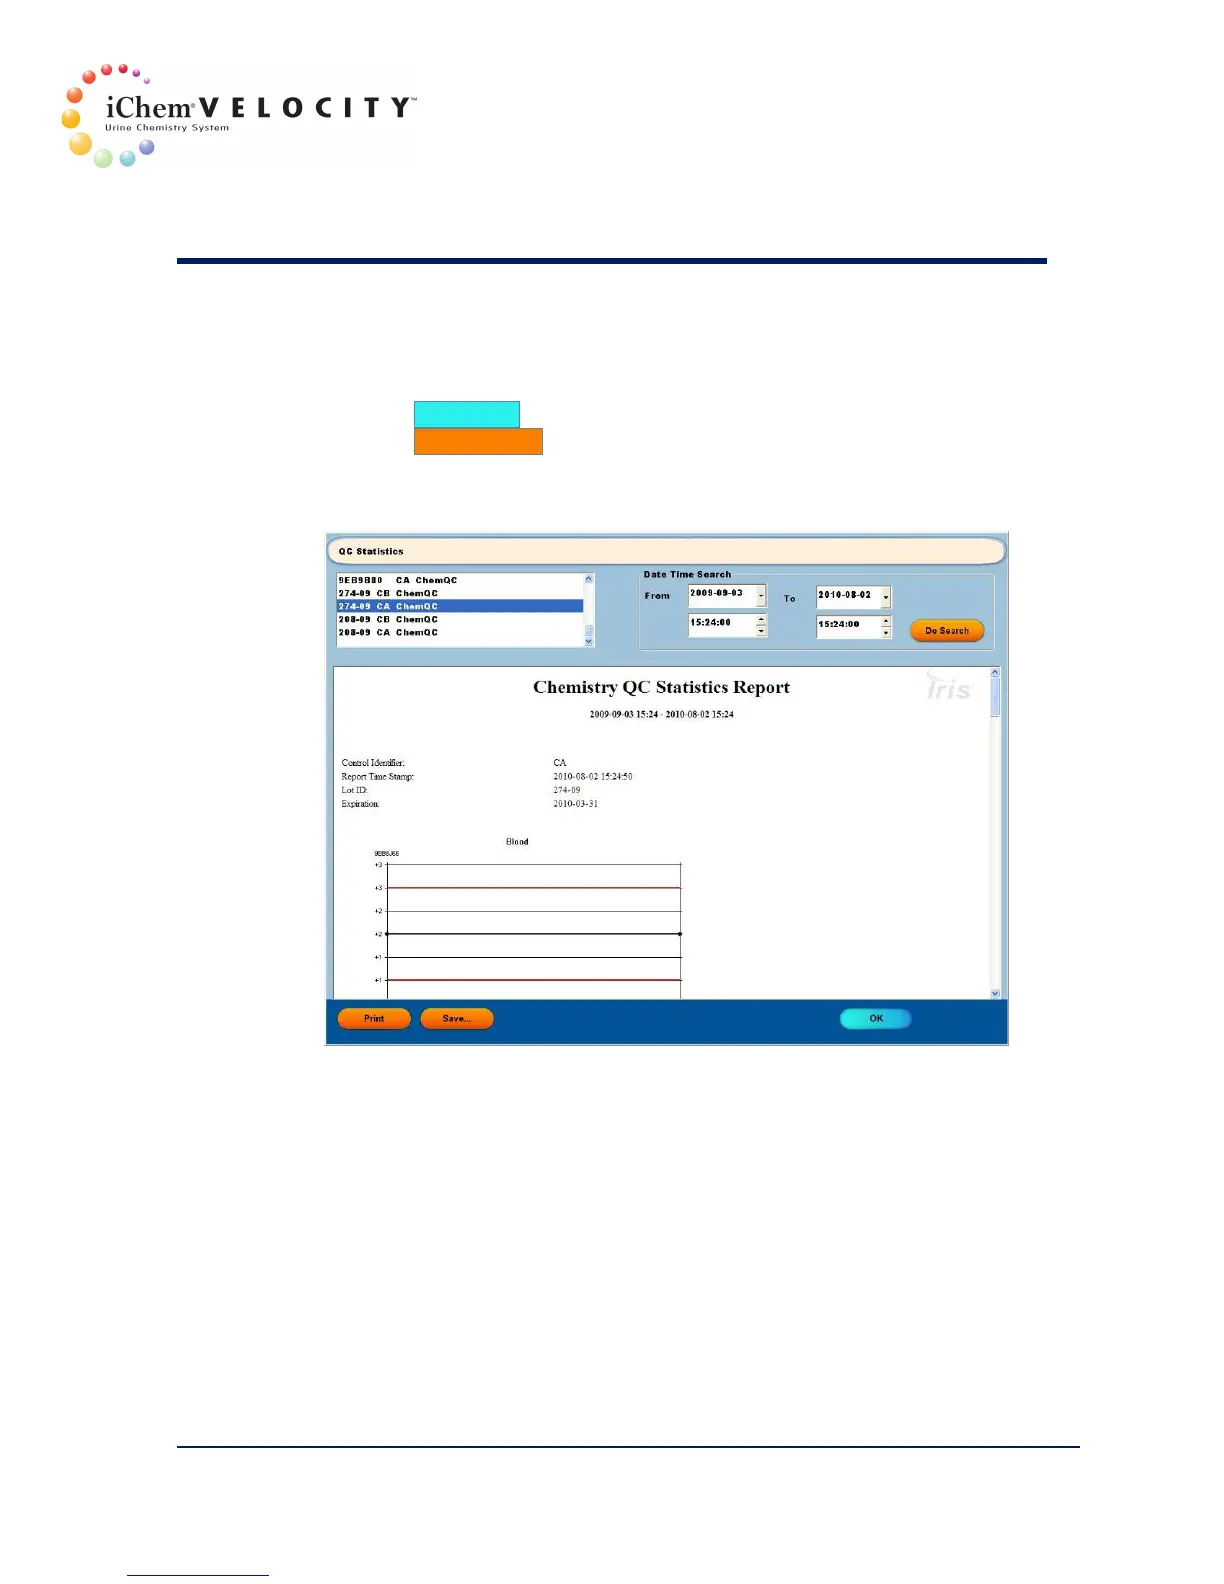
QC Statistics
1. Click Instrument.
2. Click QC Statistics. The QC Statistics screen is displayed.
3. To view a specific report, select the control lot number. The report is
displayed.
a. Chemistry QCs are plotted by QC Lot number.
b. Each type/lot specific report contains the control identifier, report
time stamp, lot number, and expiration date.
c. Chemistry QC chart indicates when chemistry strip lot changes
occurred.
d. Chemistry QC chart does not display SD, Mean, and Target lines.
e. The user can search QC statistics for the currently selected QC
material by selecting a specific time frame.
4. The next section is the Levey-Jennings chart (L-J chart), which lasts
indefinitely for the "current" lot number. All previous QC and patient
results are subject to a First In, First Out basis after 10,000 patient
and QC records are reached..