14-12 Viewing and Analyzing Results Model 831 Manual
Zooming In/out
The Model 831 provides a graphical zoom function that
displays a narrower frequency range and the spectrum on the
graph is displayed at a higher frequency resolution. This is
useful if you want to take a closer look at an area of interest.
The Model 831 allows zooming from
the configured number of lines up to
a one-to-one correspondence
between displayed lines and FFT
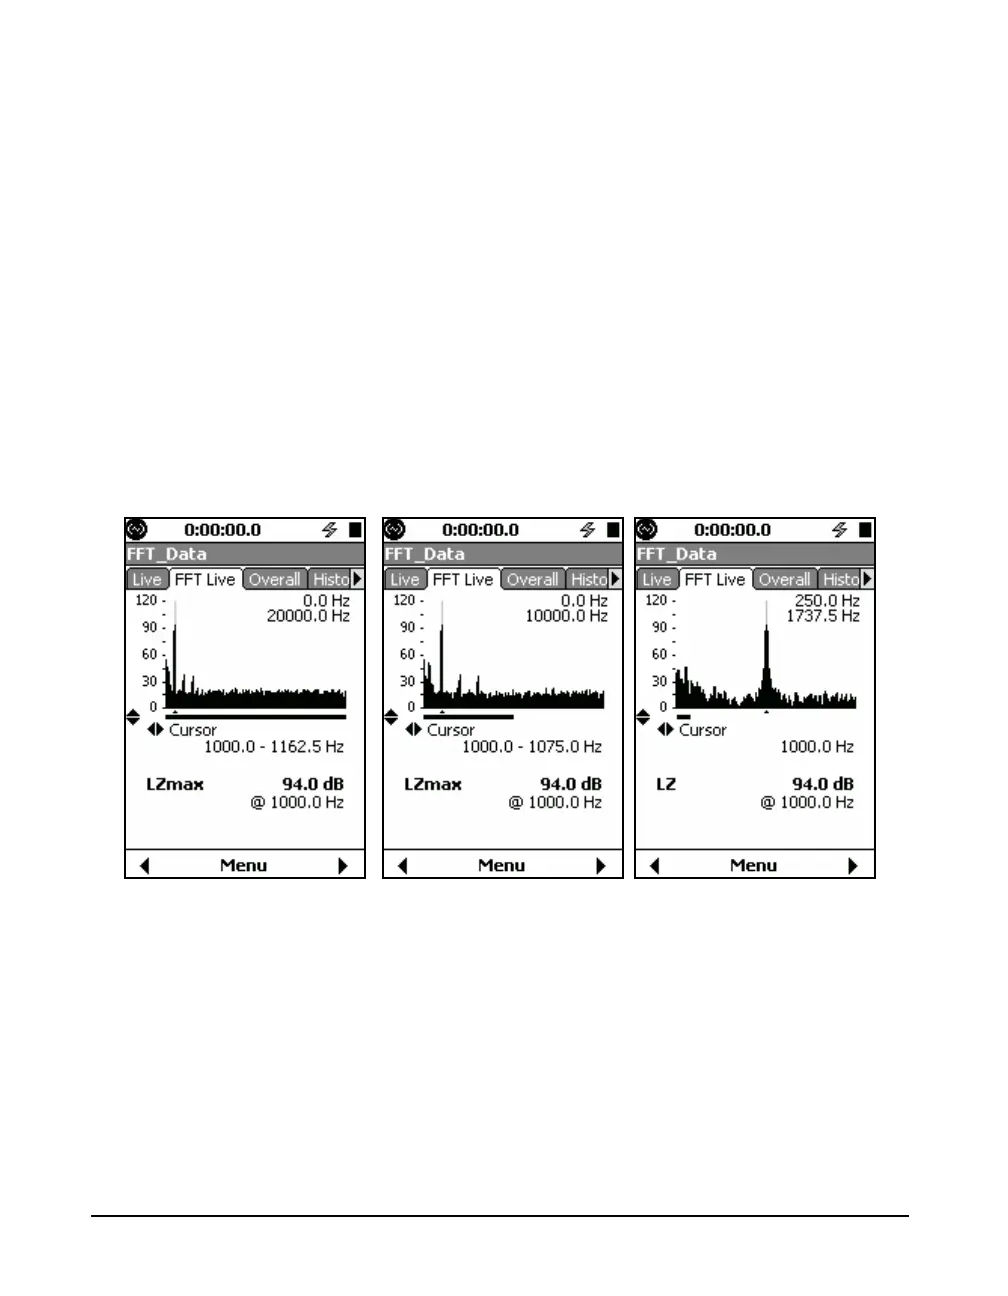
lines. When zoomed in one-to one,
the level indicator changes to
indicate that the displayed level is no
longer the max of lines, but rather
the value of the line at the cursor
(see FIGURE 14-11).
To zoom in, press the 8 key and press the 2 key to
zoom out. Notice that the bar underneath the graph indicates
the zoom level and relative position of the displayed data
within the overall dataset. Additionally, the frequency range
currently displayed on the graph is shown in the top-right
corner.
FIGURE 14-11 FFT Live Tab