14-16 Viewing and Analyzing Results Model 831 Manual
Additional Information
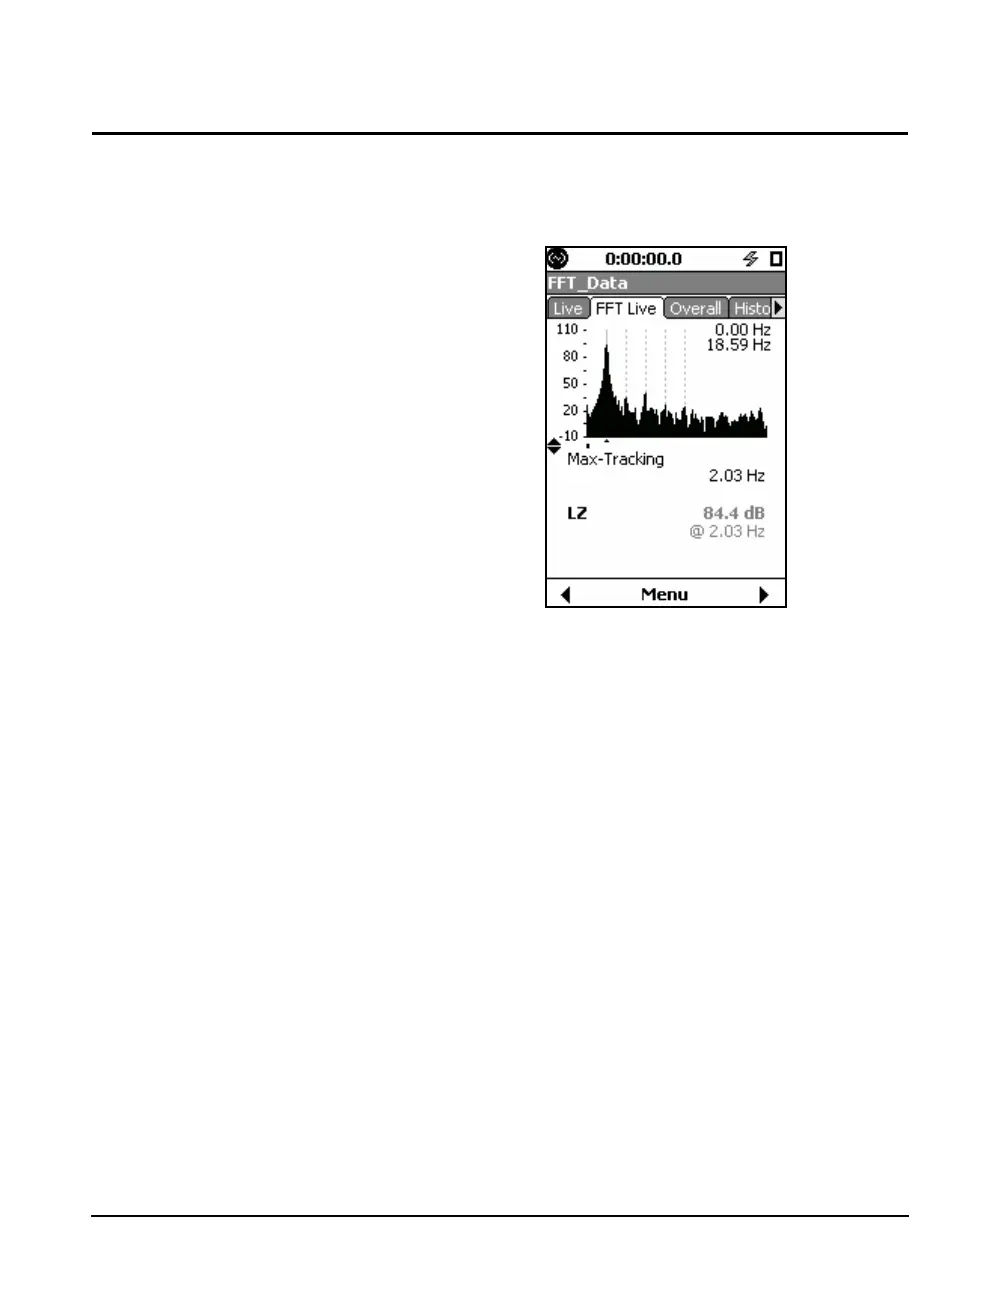
When the cursor is on a line less than 3 Hz, (-3 dB), the
displayed values are gray as shown in FIGURE 14-16.
FIGURE 14-16 Below 3Hz
The scaling of the y-axis can be adjusted as described in the
Adjust Graph Scale section of Chapter 5.