Home
Larson Davis
Measuring Instruments
831
Page 262
Larson Davis 831 - Page 262
548 pages
Manual
Save Page as PDF
To Next Page
To Next Page
To Previous Page
To Previous Page
Loading...
Model 831 Manual
V
iewing and
Analyzing Results
14-17
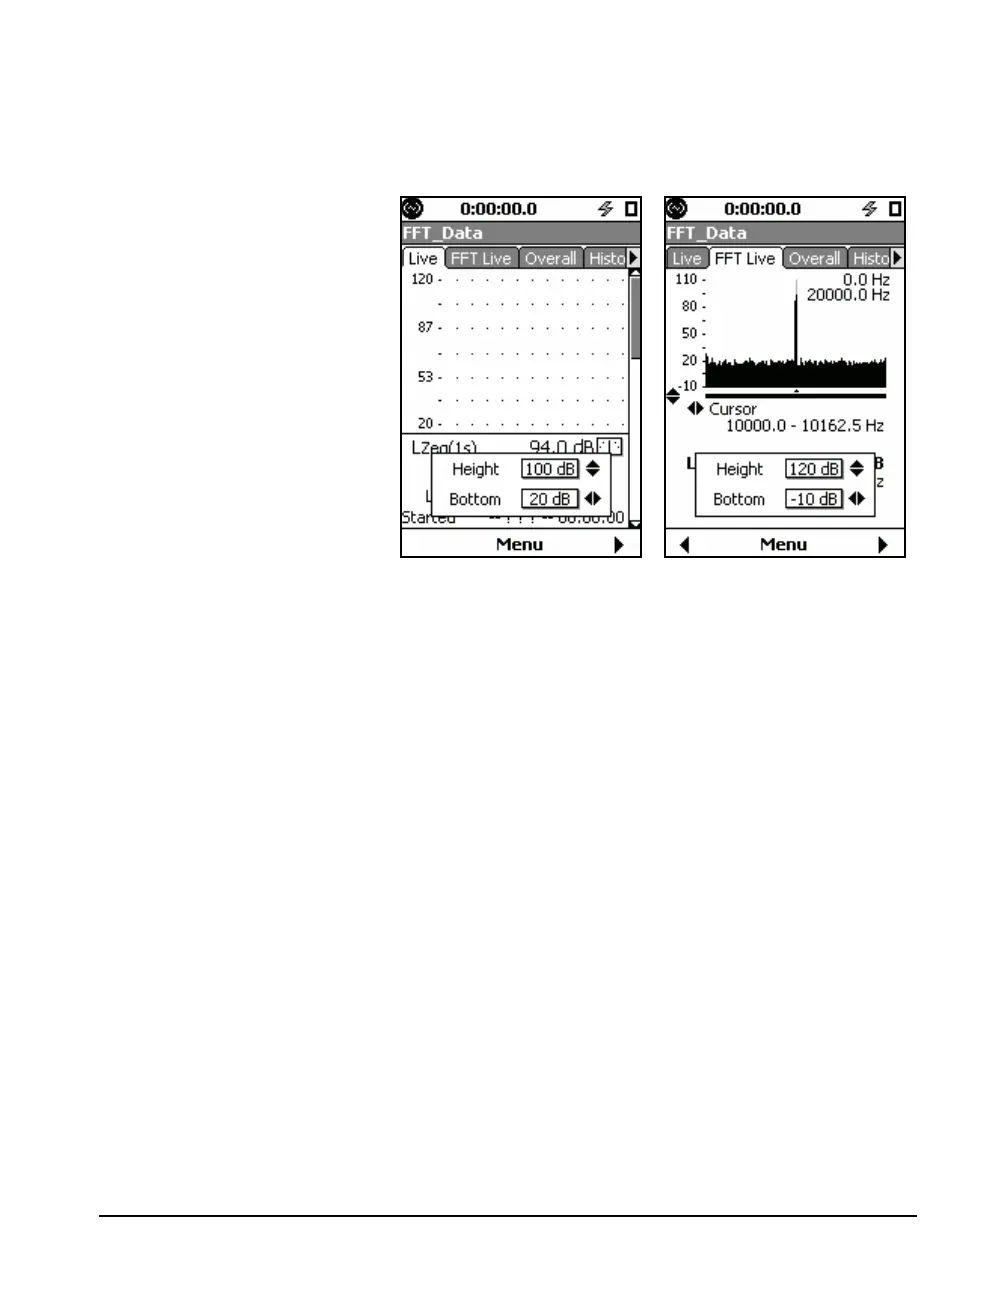
The FFT graphs on the
FFT
Live
,
Overall
, and
History
tabs
can be adjusted independently of the sound pressure level
graph on the
Live
tab as shown in FIGURE 14-6.
FIGURE 14-17 Dual Range Displays
261
263
Table of Contents
Main Page
Default Chapter
4
Table of Contents
4
831 Features
10
Chapter 1 831 Features
10
Hardware Features
10
Basic Measurements
11
Basic Operation
11
Available Options
12
Standard Accessories
13
Optional Accessories
14
Chapter 2 First Use
20
First Use
20
Unpacking and Inspection
20
Connecting the Microphone and Preamplifier
21
Connecting the Preamplifier
22
Disconnecting the Preamplifier
23
Powering the Model 831
23
External Power Supply
27
831 Components
32
Chapter 3 Overview
32
Summary of Displays and Icons
38
Basic Run Functions
43
Navigating and Selecting
43
Tab and Setting Displays
44
Chapter 6 Run Control
45
Parameter Selection
51
Chapter 4 Basic Measurement Setup
56
Settings Screen
56
Setup Tabs
57
Exiting Settings Screen
70
Setup Manager
71
Chapter 5 Data Display
80
Data Labels
80
Tabbed Structure
80
Live Tab
81
Overall Tab
91
Overall Slm
94
C-A and Impulsivity
102
Session Log Tab
104
Adjust Graph Scale
108
View Spectrum Normalized
109
Any Level Display
120
Run Control
124
Run Control Setup
124
Run Mode with Measurement History
126
Run Modes Without Measurement History
127
Chapter 7 Making a Measurement
136
Configuration of the System
136
Making a Measurement
136
Switching on the Model 831
136
Calibrating the Model 831
138
Model 831 Setup
138
Positioning the Model 831
138
Performing the Measurement
140
Measurement Range
143
Stopping the Measurement
149
Storing the Measurement
150
Recovery after Improper Shutdown
153
Calibration Overview
156
Chapter 8 Calibration
156
Control Panel - Calibrate
157
Acoustic Calibration
160
Calibration History
167
Sensitivity Tab
168
Calibration Without Preamplifier
170
Certification
171
E.A. Check
173
E.A. History
175
Chapter 9 Industrial Hygiene
176
Measurement Setup
176
Data Display
180
Chapter 10 Voice Recording
184
Control Panel - Voice Recording
184
Voice Recording
184
Voice Recorder
185
Chapter 11 Time History
188
Metrics Logged
188
Time History
188
Time History Setup
191
Time History Display
196
Locate Record Number
203
Link to Measurement History Display
204
Markers
205
Chapter 12 Measurement History
210
Measurement History
210
Run Control with Measurement History
210
Continuous and Timer Modes
211
Timed Stop Mode
212
Display of Measurement History Data
214
Manual and Stop When Stable Modes
214
Link to Time History
220
Storing a Measurement History
220
Chapter 13 Event History
222
Event History
222
Level Based Events
222
Event History Setup
223
Trigger Method
229
Event Time History Setup
231
Event History Display
242
Link to Time History and Measurement History
243
Chapter 14 FFT and Tonality
246
Configuring a Measurement
248
Viewing and Analyzing Results
255
Storing Data
266
Viewing Stored Data
266
Return to Sound Level Meter Mode
267
Accessing RT-60 Mode
268
Accessing FFT Mode
246
Chapter 15 RT-60
268
Making a Measurement
270
Viewing and Analyzing Results
275
Manually Controlling the Internal Noise Source
283
Customizing Measurements
287
General Settings
288
Storing Data
293
Viewing Stored Data
293
Quality Indicators
294
Accuracy Grade
295
Return to Sound Level Meter Mode
296
Chapter 16 Sound Recording
298
Sound Recording Types
298
Sound Recording Setup
299
Manual Sound Recording
304
Marker Initiated Recording
306
Event Sound Recording
311
Measurement History Sound Recording
315
Combined Sound Recordings
316
Sound Recording Playback
317
Chapter 17 Data Explorer
322
Data Explorer
323
Chapter 18 System Properties
332
Device
333
Time
334
Power
336
Preferences
341
Time Zone
349
Localization
351
Date Format
352
Displays
354
Options
360
Logic I/O
362
Chapter 19 Non-Acoustical Inputs
364
Weather Measurement Using 831-INT
365
Location Measurement Using 831-INT
373
Control Panel - Data Explorer
322
Control Panel - System Properties
332
831-Int
364
Chapter 20 Communication
376
Control Panel - Communication
376
Modem Tab
378
Wireless Tab
381
RS-232 Tab
383
SMS out
387
Network Tab
388
Status Tab
390
Troubleshooting
395
Chapter 21 Lock/Unlock the Model 831
404
Control Panel - Lock
404
Lock/Unlock the Model 831
404
Fully Locked
408
Locked with Auto-Store
409
Locked with Manual-Store
410
Calibration When the Model 831 Is Locked
411
About
414
Chapter 22 About
414
Control Panel - about
414
Standards
415
Options
416
User
417
Chapter 23 System Utilities
418
Control Panel - System Utilities
418
System Utilities
418
File System
419
Basic Sound Level Measurements
422
Chapter 24 Parameters Measured
422
Parameters Measured
422
Sound Exposure Metrics Measured
424
Statistical Metrics Measured
425
Event History (831-ELA Required)
427
Exceedance Counters
427
Measurement History (831-ELA Required)
427
Miscellaneous Parameters
427
Time History (831-LOG Required)
427
Chapter 25 Memory Utilization
428
Memory Utilization
428
Out of Memory Stop
428
Overall Data
428
Session Log
428
Events
429
Measurement History
429
Time History
429
Sound Recording
430
Voice Messages
430
Bad Flash Blocks
431
Chapter 26 Upgrade Firmware and Options
432
Upgrading Model 831 Firmware
433
Upgrading Options
436
Appendix A Technical Specifications
438
Standards Met by Model 831
438
Model 831 Specifications
439
Performance Specifications
441
General Specifications
445
Frequency Weightings
448
CE Information
457
1/1 and 1/3 Octave Filters
458
Position of Instrument and Operator
467
Frequency Response
469
Specifications
494
Vibration Sensitivity
499
Sections 5, 6, 7 and 9 (Except 9.3
508
Appendix B Measuring to IEC61672-1
514
Appendix C Integrated Level Calculations
514
Basic Integrated Level Calculations
514
Community Noise Descriptors
522
Appendix D Glossary
526
Related product manuals
Larson Davis 824
673 pages
Larson Davis System 824
536 pages
Larson Davis Spartan 821
129 pages
Larson Davis SoundTrack LxT
307 pages
Larson Davis HVM200
88 pages
Larson Davis Spartan 730
10 pages