14-18 Viewing and Analyzing Results Model 831 Manual
Viewing Tonality Results
To view tonality data, navigate to the Tonality tab in FFT
mode. The Tonality tab is shown in Figure 14-18.
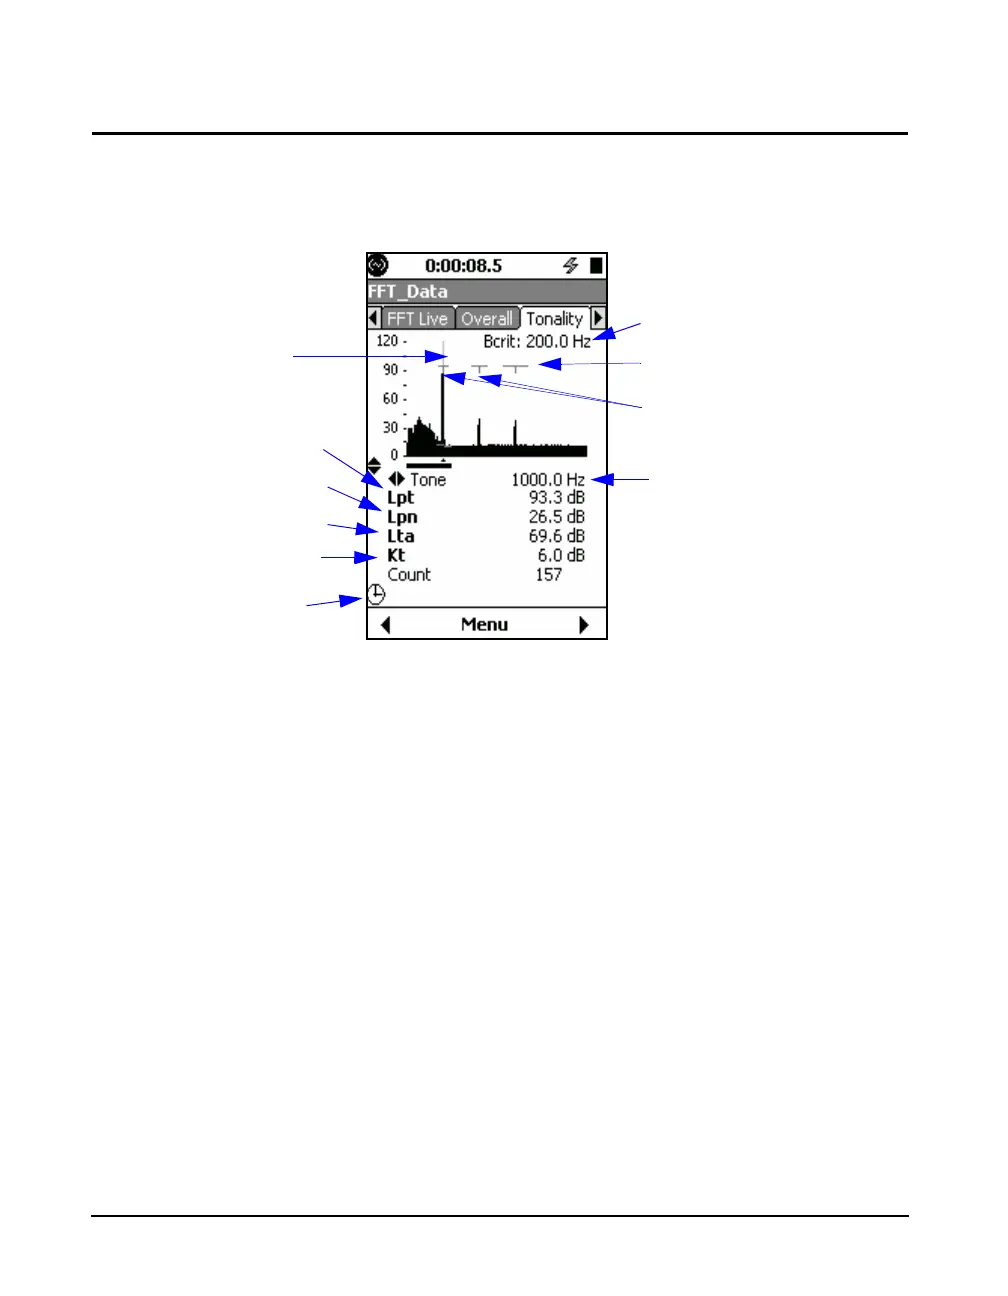
FIGURE 14-18 Tonality Data
For more information on Lpt, Lpn,
Lta, Kt, and Critical Bandwitdth, see
the ISO 1996-2 Standard, Annex C.
The Tonality graph displays critical bandwidth, tone
indicators, and noise regression.
You cannot navigate through tones
while simultaneously performing a
measurement.
To view Tonality results, you can navigate the same as you
would on other tabs in FFT mode. You can also view
specific data for each tone by navigating from tone to tone
on the graph by using the 6 and 4 keys. If a measurement is
complete, the cursor starts on the first valid tone (or the tone
corresponding to the lowest frequency). If no valid tones
exist in the measurement, you can also navigate to the
unqualified tones that do not meet bandwidth regression
criteria. You can also zoom in and out of the Tonality graph
the same as you would on other FFT graphs.
With Measurement History enabled,
you can navigate through Tonality
measurement records, just as you
can with other FFT measurements.
Additionally, you can specify the cursor type appearing on
the Tonality graph to be Manual or Max-Tracking in the
same way as other FFT results. You can also specify the
number of harmonic cursors appearing on the Tonality
Noise Level
Tone Audibility Level
Tone Level
Adjustment
Quality
Indicator
Critical Bandwidth of
the Selected Tone
Tone Markers
Tone Frequency
Critical Bandwidth Indicator
Cursor