Model 831 Manual Viewing and Analyzing Results 14-19
graph, similar to other FFT results. For more information,
see the "Changing the Cursor Type" section in this chapter.
Tonality Measurement Deficiencies
When the % indicator is displayed,
the graph will show narrow bands of
noise that do not meet the bandwidth
requirements in the Tonality
Standard. You can navigate and view
information on these bands the same
as if they were valid tones according
to the Tonality Standard.
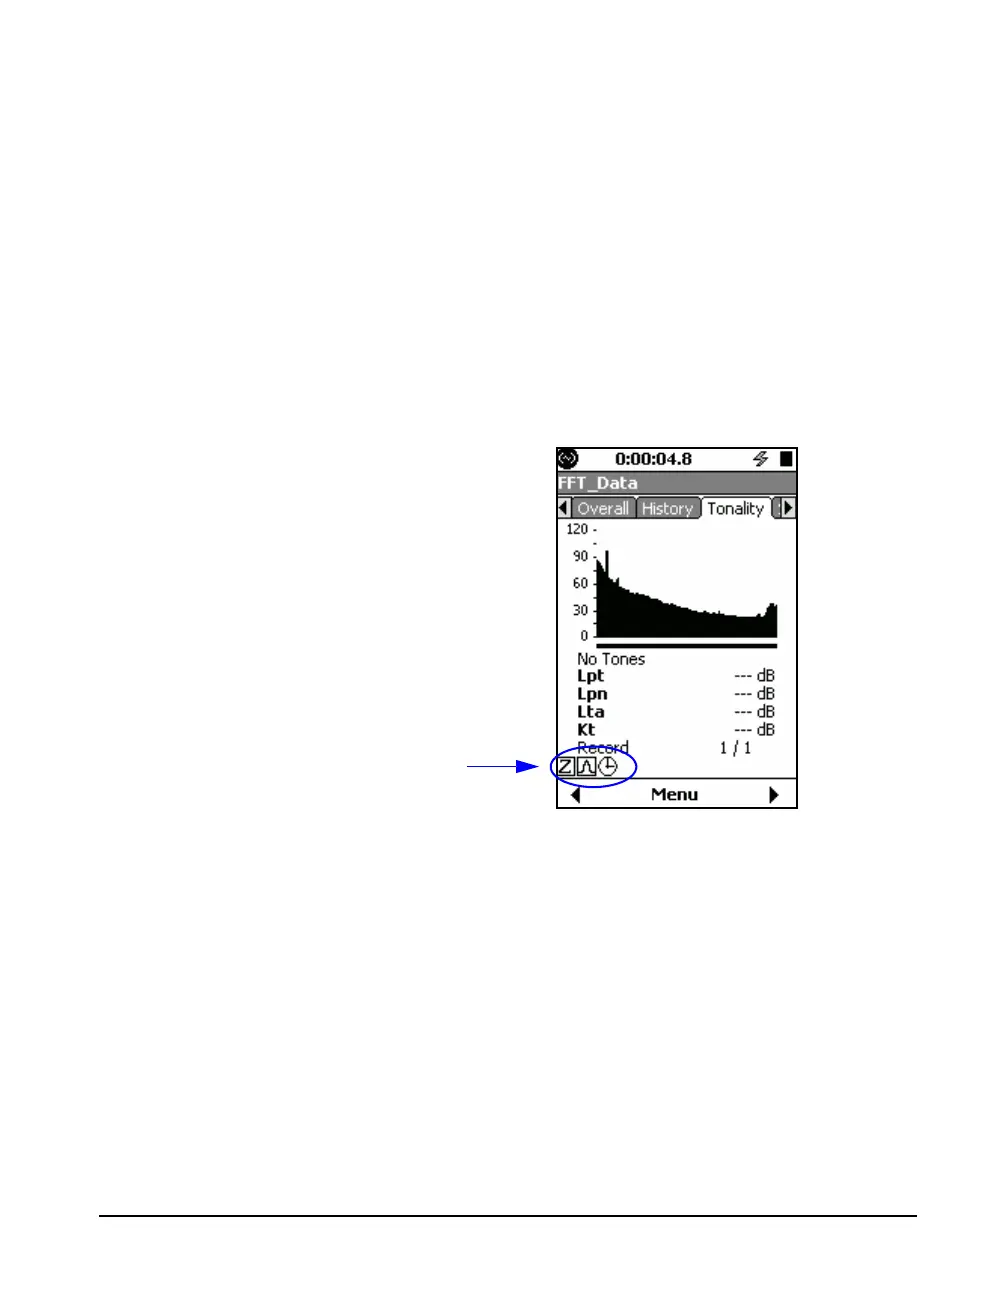
The Tonality tab displays quality indicators when
deficiencies, in relation to the ISO 1996-2 Standard, are
detected in measurements.
Figure 14-19 shows an example of the Tonality tab with
quality indicators appearing.
FIGURE 14-19 Quality Indicators on Tonality Tab
Table 14-6 describes each quality indicator, the
corresponding deficiency for each indicator, and the remedy
for each deficiency.
Quality Indicators for
Tonality Measurement