Model 831 Manual Viewing and Analyzing Results 15-11
RT-60 Decay Curve
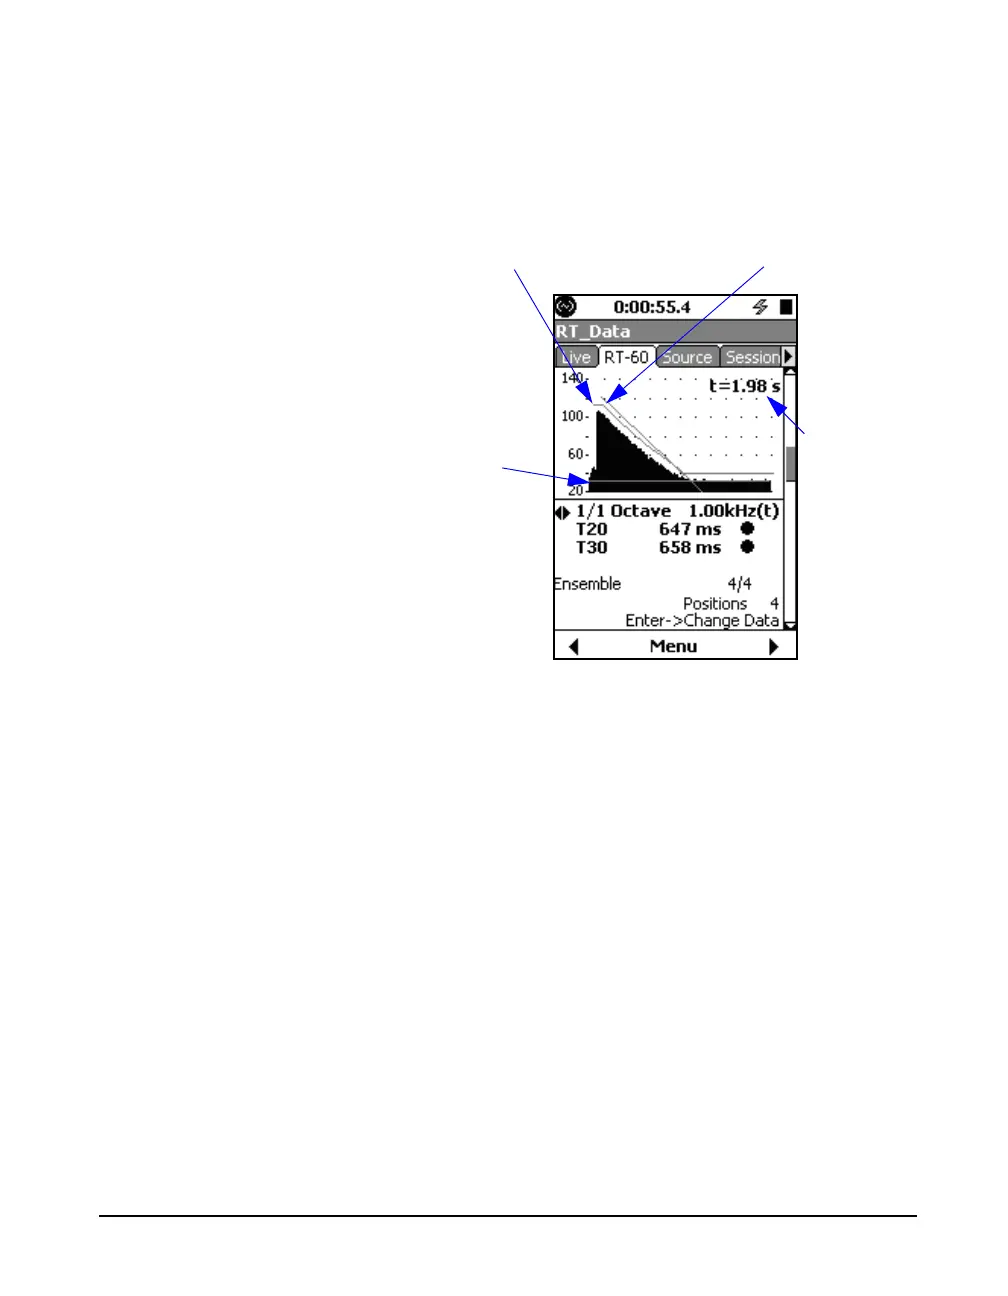
The RT-60 Decay Curve display shows the time domain
ensemble or individual decay curve.
In the upper right corner of the
display is a t=1.98s. This value
represents the time duration of the
data being displayed
FIGURE 15-16 RT-60 Decay Curve
The linear regression line on the graph is usually associated
with the T30. However, if the T30 decay time was
undetermined, the T20 data is used. When the Impulse
method is used, the reverse integration curve is also shown
on the graph.
Reverse Integration Linear Regression
Background
Level
Time shown
on x-axis