15-12 Viewing and Analyzing Results Model 831 Manual
Excitation Levels
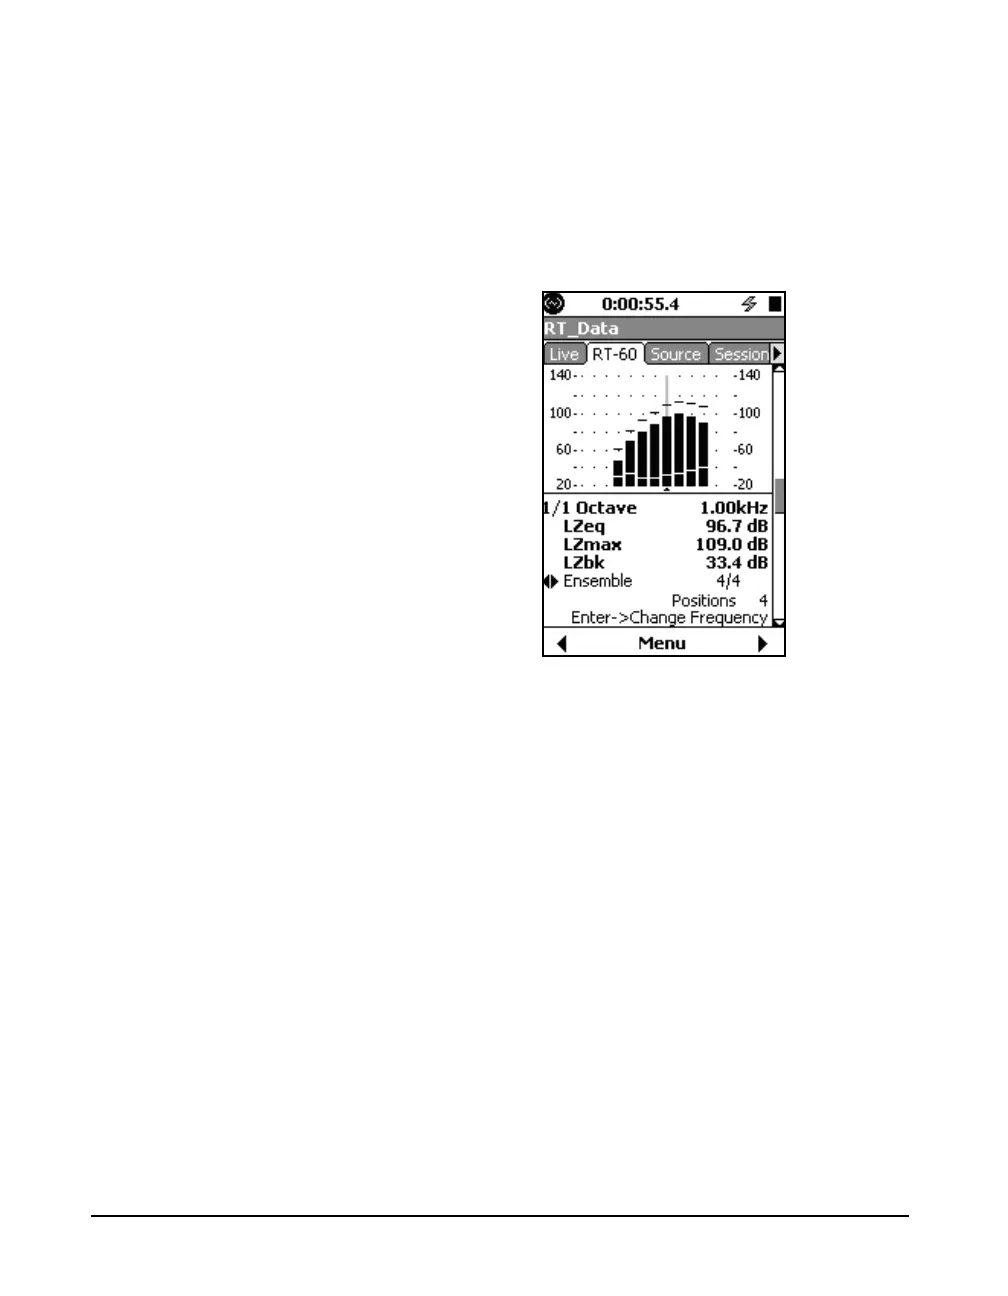
The Excitation Levels display shows the equivalent,
maximum, and background levels for all frequency bands of
the ensemble average or for an individual decay. From this it
can be determined which frequencies were sufficiently
energized for a desired decay range.
FIGURE 15-17 Excitation Levels
LZeq is computed as the Leq between the initial exceedance
of the trigger level to when the signal falls below the trigger
level minus 5 dB.
LZmax is the maximum value of the time history.
LZbk is the background level measured for this frequency at
this position.