Model 831 Manual Viewing and Analyzing Results 15-13
Quality Summary
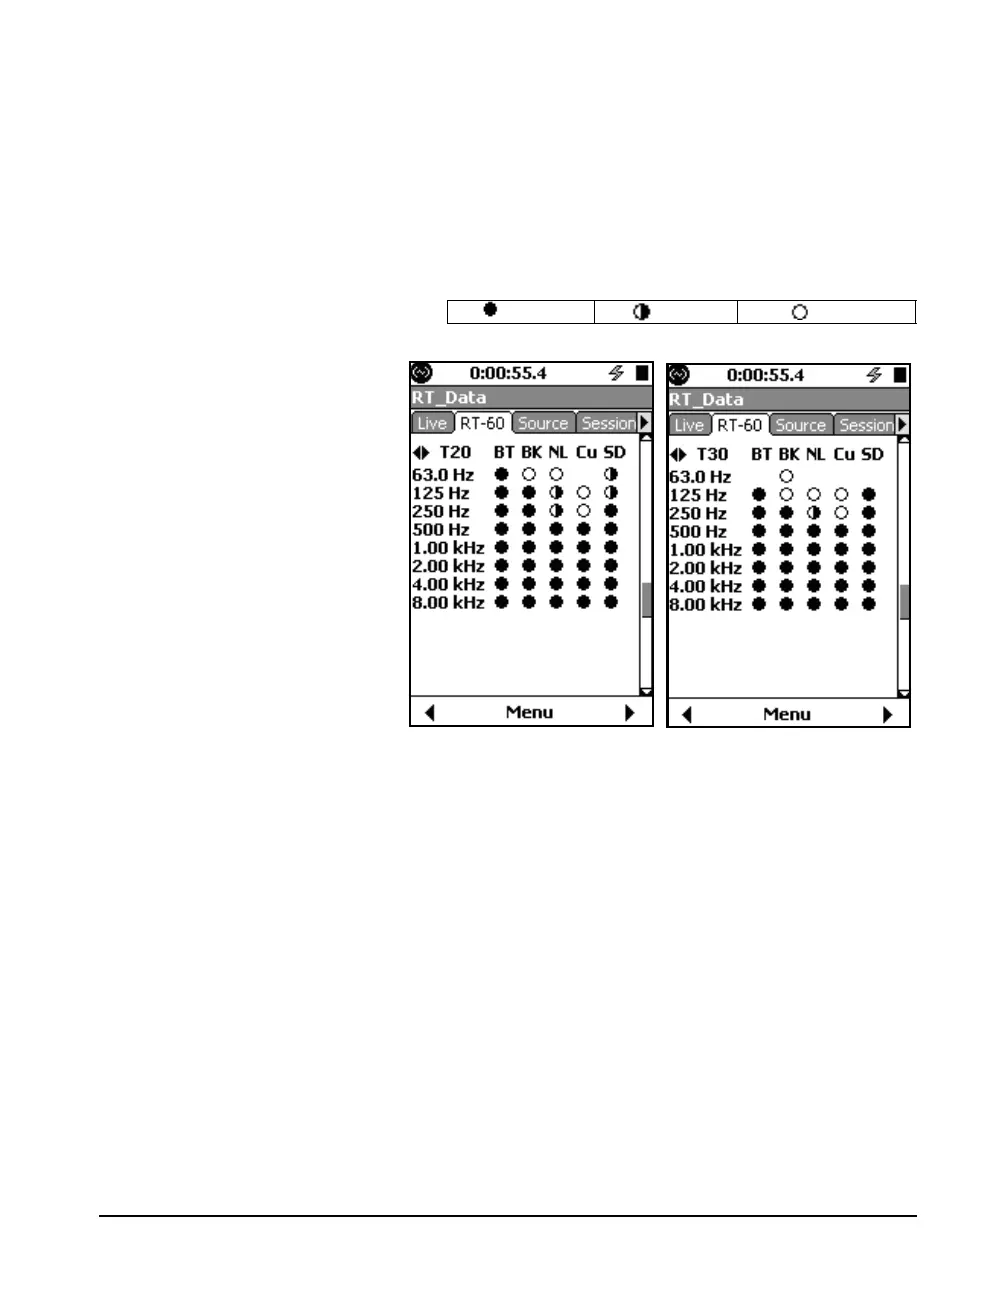
The left/right arrows keys will toggle
between T20 and T30.
This display provides a summary of the quality indicators
for all frequencies between the configured highest and
lowest filters. For 1/3 octave measurements, this display
may span two pages. For more information about the quality
indicators, see the “Quality Indicators” on page 15-27.
If a decay time could not be
determined, the quality indicator
icon will not be present.
FIGURE 15-18 Quality Summary
=Good =Fair =Poor