Table 7-29 Production Graph Screen Elements
Screen Components Description
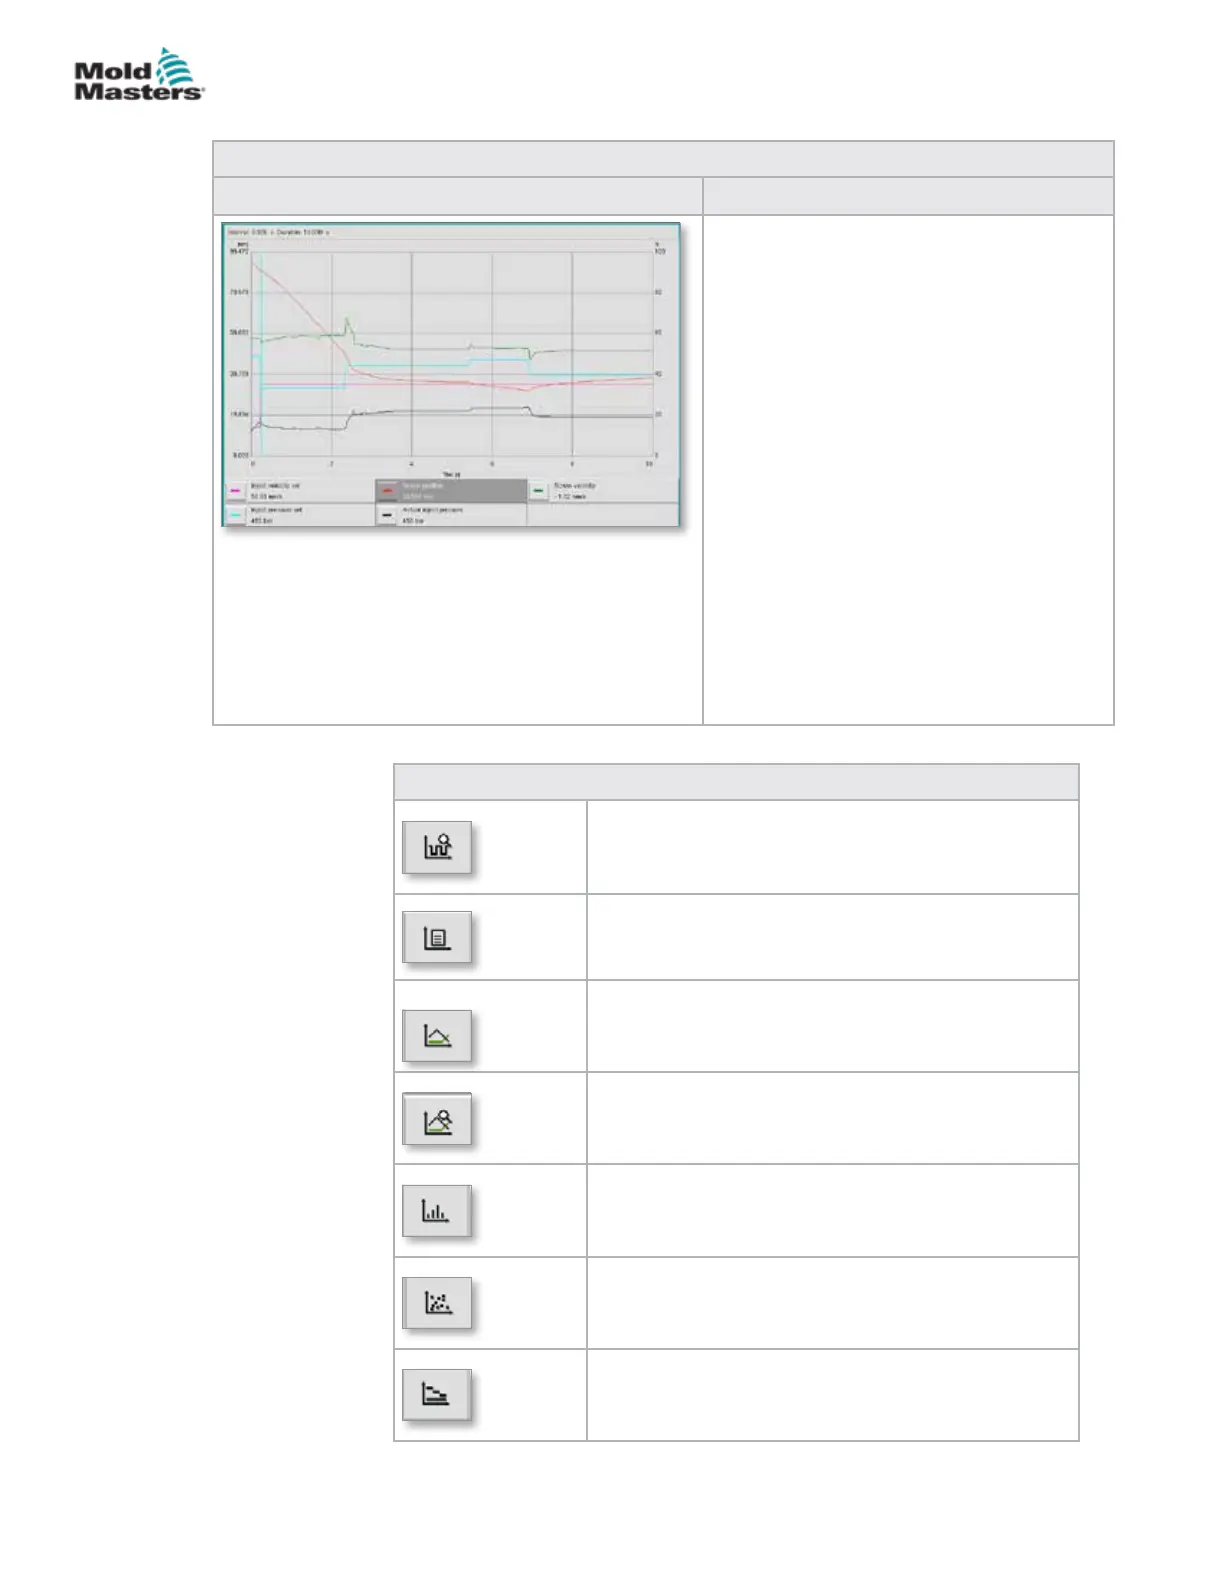
The screen shows a graph of a selected
variable. The variable name and the current
values are shown below the graph. The
following functions are possible:
• Denition of reference graph
• Display of the last trend graph
• Monitoring using a chosen tolerance
band
The transition point, (the point at which
the system changes from injection to hold
pressure) is shown as a turquoise vertical
line. The transition point range is shown
as a white bar at the upper edge of the
diagram. In a properly set up process, this
bar should be very narrow. The mean value
of all transition points is shown as a black
line within the white bar.
The display mode can be set as:
• Time (y/t graph)
• Position (y/x graph)
• Split (mixed form, both diagram types)
Table 7-30 Production Graph Screen Context Menu Buttons
Software Oscilloscope (SWO)
Congurable view
PD - Protocol
Production data in table format
PD - Line Graph
Production data in line graph format
PD - Supervisor
Production data Supervisor settings
PD - Histogram
Production data in histogram format
PD - Scatter Graph
Production data in scatter graph format
PD - Cycle Time
Production data on cycle time
Production Graph Screen - continued
7-52
© 2020 Mold-Masters (2007) Limited. All Rights Reserved.
E-MULTI CONTROLLER HMI INTERFACE
E-Multi Controller User Manual