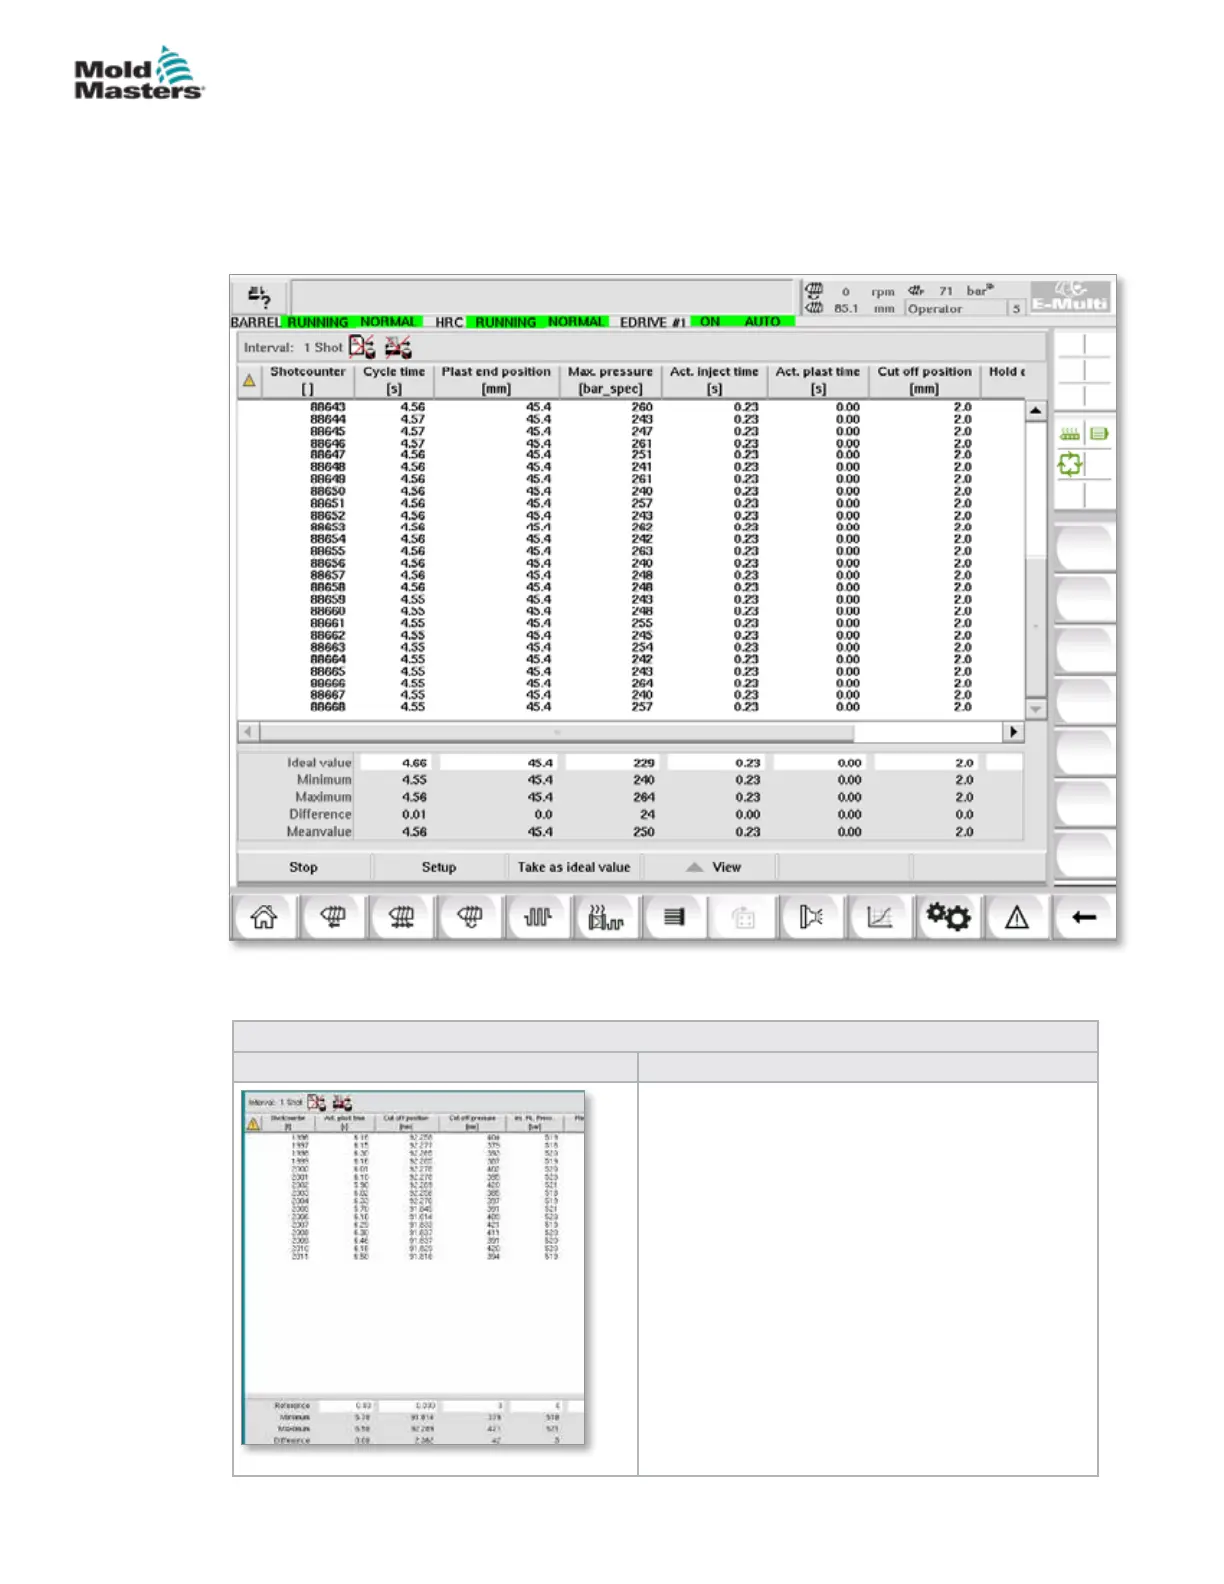
7.20 Process Data (PD) Protocol Screen
The process data protocol screen serves to show process data in tabular
form. The recorded values can be printed out during measurement or saved
to a le for analysis. The context menu button on the right can also be used
to view the process data in other forms (histogram, scatter graph, etc.). See
the controller help le for information on saving and printing recorded values.
Figure 7-21 Process data protocol screen
Table 7-33 Process Data Screen Components
Screen Components Description
The recorded system variables are shown in a
table. Process variables are user selectable and
any number of variables may be selected.
The table can be scrolled horizontally and
vertically.
The color scheme of the individual columns can
be selected in PDP setup.
The lower part of the screen shows the reference
value, minimum, maximum and the dierence
between the two values, as well as the mean
value for each process value.
The number of cycles (injections) that are taken
into account can be adjusted. The default is 20
cycles.
7-57
© 2020 Mold-Masters (2007) Limited. All Rights Reserved.
E-MULTI CONTROLLER HMI INTERFACE
E-Multi Controller User Manual