Table 7-11 Hold Setting Screen Components
Screen Components Description
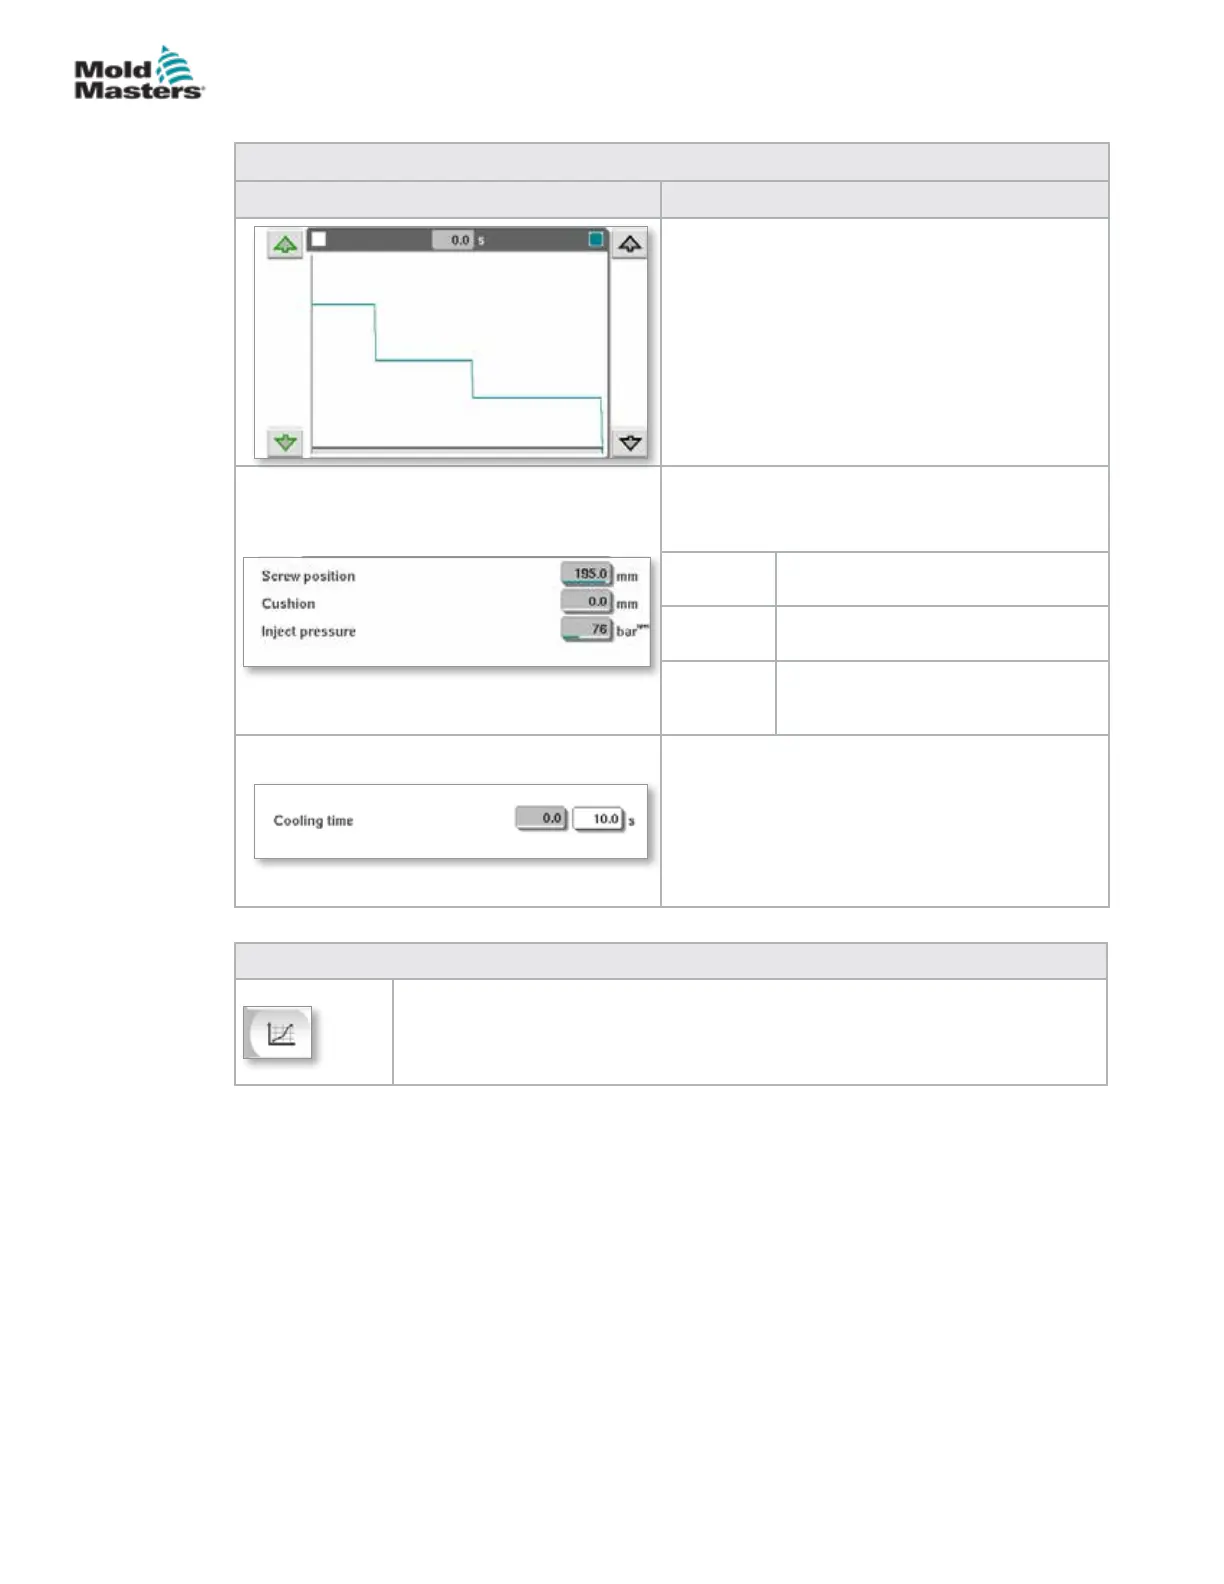
Pressure and Velocity Input Graph
Alternatively, the Pressure (teal) and the Velocity
(grey) values are shown in the form of prole
graphs and the values can be adjusted using the
arrow keys next to the prole graphs.
On each click of the arrow, the prole graph is
adjusted by +/-5 bar and/or +/-5%.
Data Display
This area of the screen displays current
pressure and screw position information.
Screw
position
Maximum screw forward position at
the end of hold.
Cushion Display of melt cushion at the end
of injection.
Inject
pressure
Displays the current injection
pressure.
Cooling Time
The current cooling time (actual value) is shown
in the left eld (grey). The cooling time (set
point) may be entered into the right (white) eld.
Table 7-12 Hold Settings Screen Context Menu Buttons
Production Graphs
Navigates to the Production Graph screen which provides real time data on the
current production process.
Hold Settings Screen - continued
7-17
© 2020 Mold-Masters (2007) Limited. All Rights Reserved.
E-MULTI CONTROLLER HMI INTERFACE
E-Multi Controller User Manual