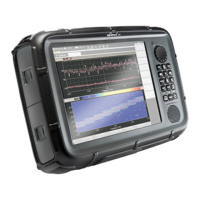
8 Spectrum Analysis Mode
Narda SRM-3006 109
8.2.5 Adjusting the Y axis (Y-Scale)
Spectrum Analysis • Display • Y-Scale Range
Spectrum Analysis • Display • Y-Scale Ref
Spectrum Analysis • Display • Y-Scale Auto
⇒ See Adjusting the Y axis on page 88
8.3 Evaluating the measurement data
(Evaluation)
The Evaluation menu contains the following functions for evaluating the
measurement data:
• Peak Table
Generates a table containing 50 measured peak values.
• Integration
Integrates the measured values over a defined frequency range.