9 Level Recorder Mode
Narda SRM-3006 119
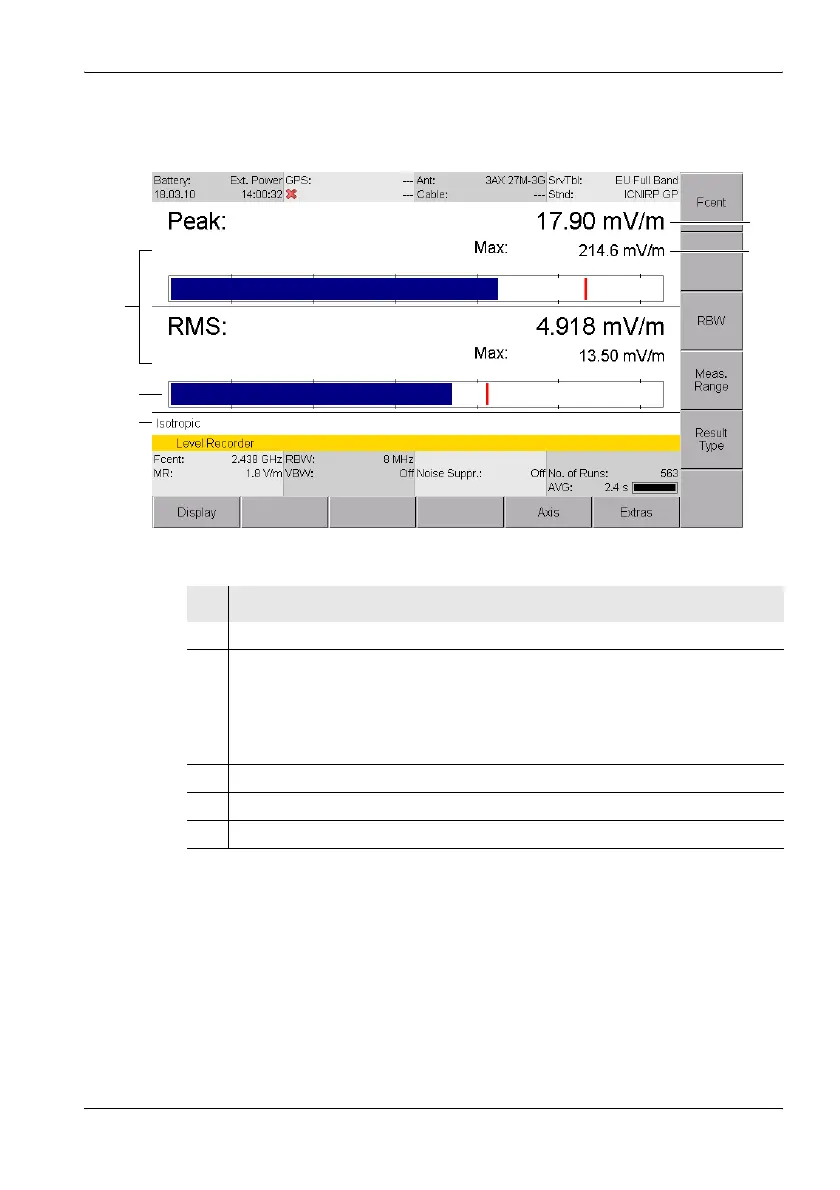
9.2 Display overview
Figure 25: Level Recorder mode with display of Peak and RMS.
1
2
4
5
3
No. Function / Explanation
1 Display area with selectable detector types Peak and RMS
2 Bar graph displaying the current level:
• Red line: indicates the maximum measured level
• Bar: indicates the level at the moment
Note: The maximum extent of the bar corresponds to the selected
measurement range (Meas. Range softkey)
3 Selected axis type
4 Numerical display of current measured value
5 Numerical display of maximum measured value