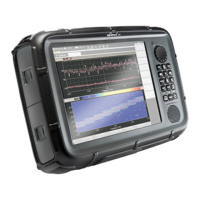
8 Spectrum Analysis Mode
110 SRM-3006 Narda
8.3.1 Displaying the peak values (Peak Table)
Spectrum • Evaluation • Peak Table
The highest peaks (up to 50) in the frequency spectrum under consideration
are listed in the Peak Table. These are true peak values.
Figure 23: Peak Table in Spectrum Analysis mode
Table 29: Elements in the Peak Table
Column header Description
Index Sequence number of the peak (up to 50)
Frequency Frequency value of the peak
Service Service to which the peak (frequency value) belongs
Avg
Max
Result types
The columns displayed depend on the result types that have
been selected (see next section).