6 Functions Common to More Than One Operating Mode
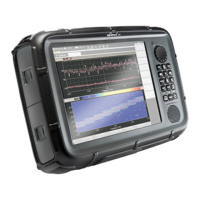
76 SRM-3006 Narda
6.4.1 Average formation (Result type: Average)
An average can be formed over a specific number of measurements or over
a period of time.
Taking the average of a number of measurements:
✓ Result type Average is selected (the actions described below can
nevertheless be carried out even if this result type is not selected).
1. Press the Result Type softkey.
2. Press the Average Type softkey until Average Time is shown (toggle
function).
Note: If you operate the rotary control after opening the selection window,
the softkeys for selecting the average type and the parameters for
forming the average will be blanked out. If this happens, close the
selection window (press ESC) and then open it again.
3. Press the No. of Avg softkey, then use the rotary control to select the
desired number of measurements, and then press the OK key.
ª The measurements start. The AVG line shows the selected number
of measurement values and a bar graph next to this shows the
progress towards the formation of the first average value.
Taking the average over a period of time:
✓ Result type Average is selected (the actions described below can
nevertheless be carried out even if this result type is not selected).
1. Press the Result Type softkey.
2. Press the Average Type softkey until No. of Avg is shown.
Note: If you operate the rotary control after opening the selection window,
the softkeys for selecting the average type and the parameters for
forming the average will be blanked out. If this happens, close the
selection window (press ESC) and then open it again.
3. Press the Average Time softkey, then use the rotary control to select the
desired time period, and then press the OK key.
ª The measurements start. The AVG line shows the selected time
period numerically and a bar graph next to this shows the progress
towards the formation of the first average value.