7 Safety Evaluation Mode
Narda SRM-3006 103
7.4 Using the Bar Graph view
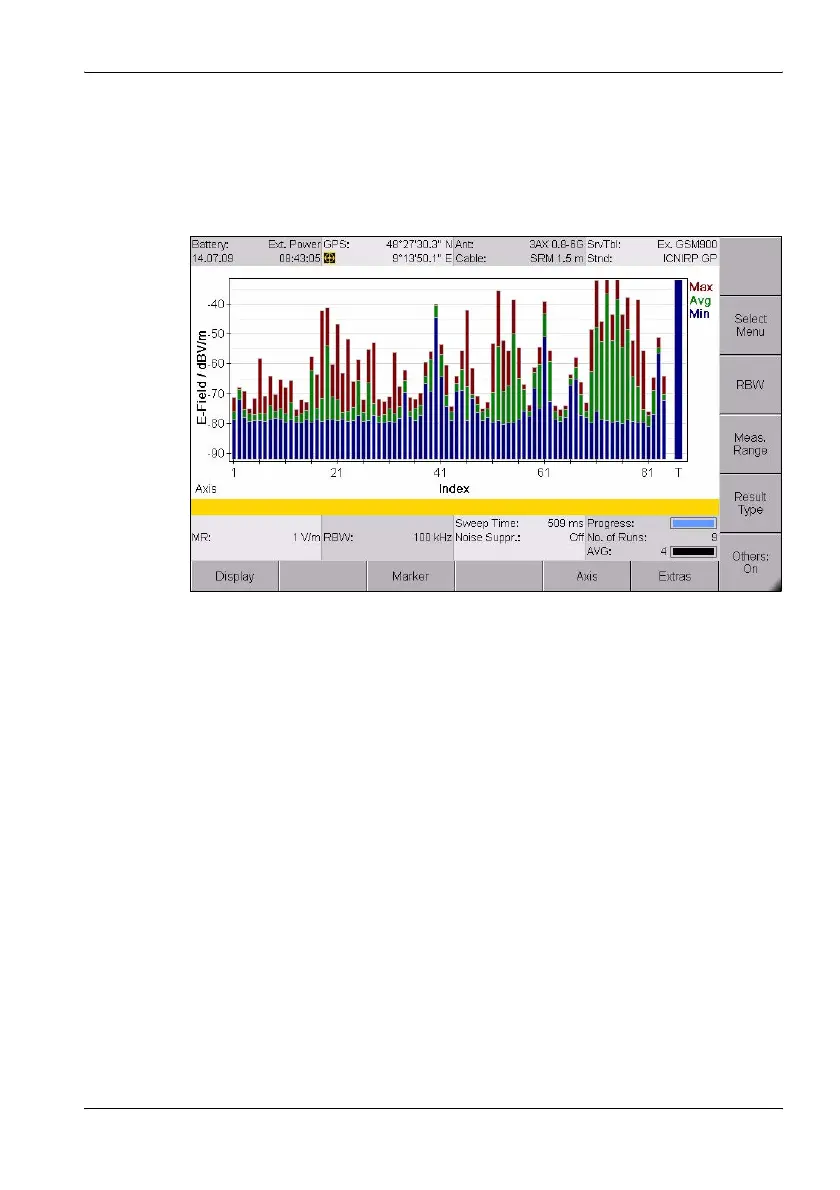
The measured values are shown as bars in the Bar Graph view. The
selected result types are shown as abbreviations in the diagram on the right
and shown in the corresponding colors in the diagram.
Figure 21: Bar Graph view in Safety Evaluation mode
Note: Information about the status bars is found under The upper status
bar on page 43 and The lower status bar on page 44.
7.4.1 Adjusting the Y axis (Y-Scale)
Safety Evaluation • Display • Y-Scale Range
Safety Evaluation • Display • Y-Scale Ref
Safety Evaluation • Display • Y-Scale Auto
⇒ See Adjusting the Y axis on page 88.
7.4.2 Changing the displayed units (Unit)
Safety Evaluation • Display • Unit
⇒ See Changing the displayed units on page 89.