Contents
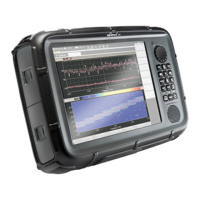
Narda SRM-3006 V
7 Safety Evaluation Mode . . . . . . . . . . . . . . . . . . . . . . . . . . . . . . . . . . . 93
7.1 About Safety Evaluation mode. . . . . . . . . . . . . . . . . . . . . . . . 94
7.2 Basic settings. . . . . . . . . . . . . . . . . . . . . . . . . . . . . . . . . . . . . 96
7.2.1 Selecting the display mode . . . . . . . . . . . . . . . . . . . . . . . . . . 96
7.2.2 Activating the beeper . . . . . . . . . . . . . . . . . . . . . . . . . . . . . . . 96
7.2.3 Showing and hiding services . . . . . . . . . . . . . . . . . . . . . . . . . 97
7.2.4 Setting the resolution bandwidth (RBW) . . . . . . . . . . . . . . . . 97
7.2.5 Setting the measurement range (Meas. Range) . . . . . . . . . . 98
7.2.6 Selecting the result type (Result Type) . . . . . . . . . . . . . . . . . 98
7.2.7 Measuring in the gaps between defined services (Others) . . 99
7.3 Using the Table view . . . . . . . . . . . . . . . . . . . . . . . . . . . . . . . 99
7.3.1 Changing the table displayed. . . . . . . . . . . . . . . . . . . . . . . . 100
7.3.2 Percentage display . . . . . . . . . . . . . . . . . . . . . . . . . . . . . . . 101
7.4 Using the Bar Graph view . . . . . . . . . . . . . . . . . . . . . . . . . . 103
7.4.1 Adjusting the Y axis (Y-Scale) . . . . . . . . . . . . . . . . . . . . . . . 103
7.4.2 Changing the displayed units (Unit) . . . . . . . . . . . . . . . . . . . 103
7.4.3 The Marker function. . . . . . . . . . . . . . . . . . . . . . . . . . . . . . . 104
7.5 Selecting an axis mode . . . . . . . . . . . . . . . . . . . . . . . . . . . . 104
8 Spectrum Analysis Mode . . . . . . . . . . . . . . . . . . . . . . . . . . . . . . . . . 105
8.1 About Spectrum Analysis mode . . . . . . . . . . . . . . . . . . . . . 106
8.2 Basic settings. . . . . . . . . . . . . . . . . . . . . . . . . . . . . . . . . . . . 106
8.2.1 Changing the frequency range . . . . . . . . . . . . . . . . . . . . . . 107
8.2.2 Setting the resolution bandwidth (RBW) . . . . . . . . . . . . . . . 108
8.2.3 Setting the video bandwidth (VBW). . . . . . . . . . . . . . . . . . . 108
8.2.4 Changing the displayed units (Unit) . . . . . . . . . . . . . . . . . . . 108
8.2.5 Adjusting the Y axis (Y-Scale) . . . . . . . . . . . . . . . . . . . . . . . 109
8.3 Evaluating the measurement data (Evaluation). . . . . . . . . . 109
8.3.1 Displaying the peak values (Peak Table) . . . . . . . . . . . . . . . 110
8.3.2 Integrating measured values (Integration) . . . . . . . . . . . . . . 112
8.4 The Marker function (Marker) . . . . . . . . . . . . . . . . . . . . . . . 114
8.5 The Zoom function (Zoom) . . . . . . . . . . . . . . . . . . . . . . . . . 114