Monitoring System Access and Performance
460
ProSecure Unified Threat Management (UTM) Appliance
View the Network Status Screen
To view the Network Status screen, select Monitoring > System Status > Network Status.
The Network Status screen displays. (The following figure shows the Network Status screen
of the UTM50. The Network Status screen of the UTM9S also shows the available wireless
access point, and has a Wireless Statistics option arrow in the upper right of the screen.)
ReadyNAS Status The status of the ReadyNAS connection:
• OFF. The ReadyNAS is not connected.
• NORMAL. The ReadyNAS is connected and functions normally.
• FAILED. The ReadyNAS is connected but is unreachable.
Quarantine Status The status of the quarantine area:
• OFF. The quarantine area is disabled.
• NORMAL. The quarantine area is enabled and functions normally.
• FAILED. The quarantine area is enabled but is unreachable.
Active TCP connections The number of active connections that use TCP.
Active UDP connections The number of active connections that use TCP.
Services The protocols that are being scanned for malware threats (ON or OFF is stated next
to the protocol) and the number of active connections for each protocol.
System Information
States the system up time since last reboot.
Firmware Information The versions and most recent downloads for the active and secondary firmware of
the UTM, the scan engine, pattern file, and firewall.
Click + More to display the versions and most recent downloads for the DC agent,
SSE engine, SSE pattern, Mini engine, Mini pattern, Update client, IPS engine, IPS
rules, Scand, and Urld.
License Expiration Date The license expiration dates for the email protection, web protection, and
maintenance licenses.
Note: When a license has expired, the license expiration date is displayed in red
font.
Hardware Serial Number The hardware serial number of the UTM.
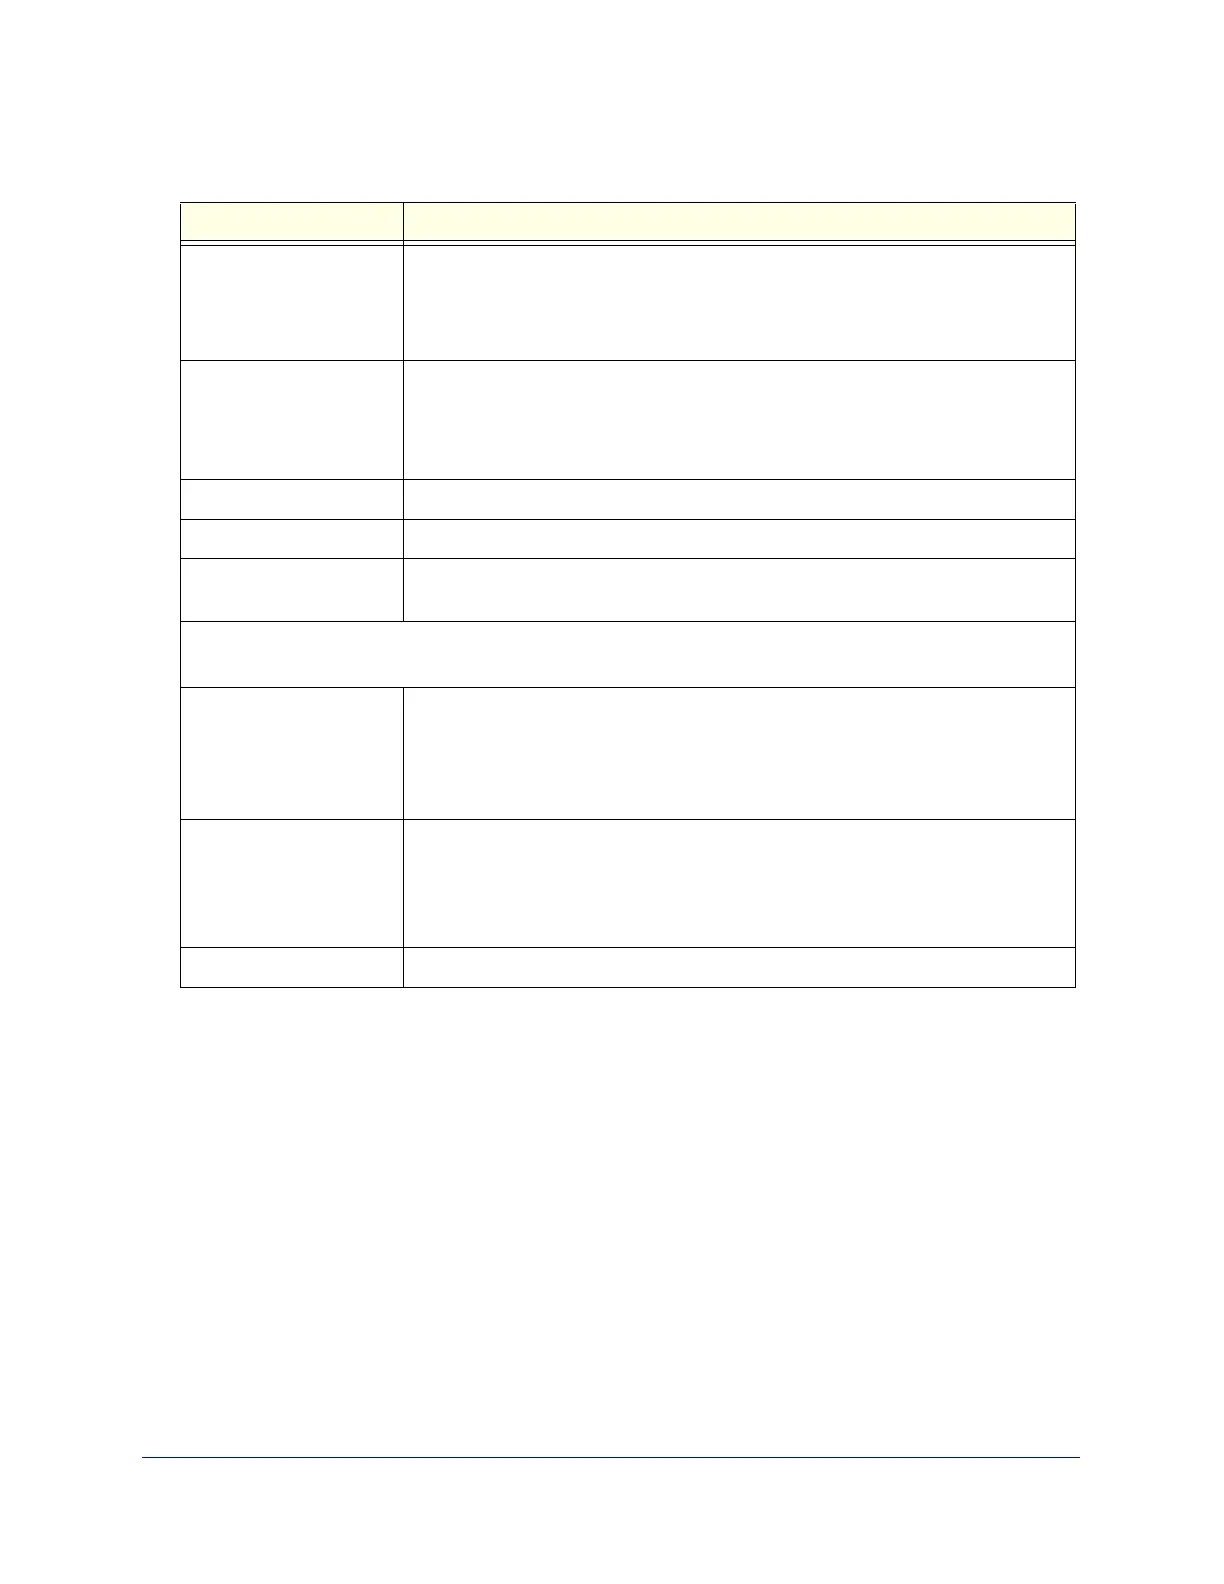
Table 117. System Status screen fields (continued)
Item Description