Monitoring System Access and Performance
462
ProSecure Unified Threat Management (UTM) Appliance
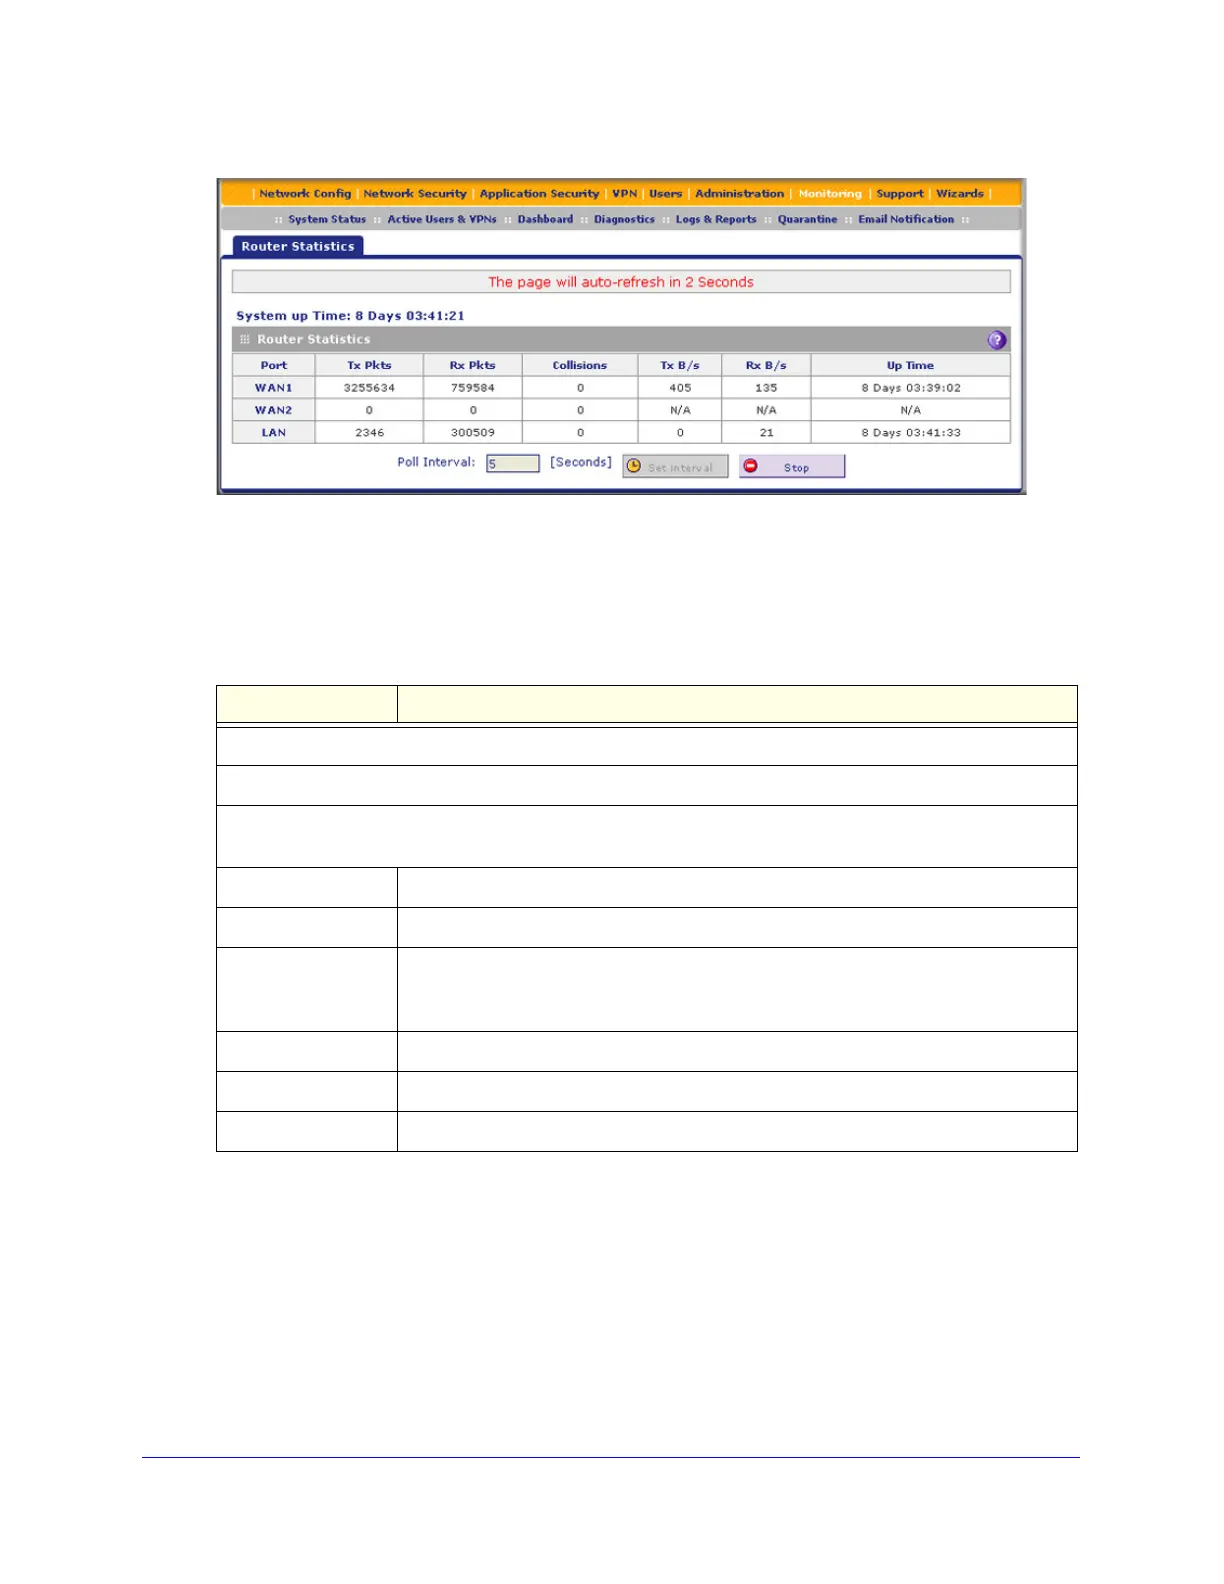
Figure 272.
The following table explains the fields of the Router Statistics screen.
To change the poll interval period, enter a new value in the Poll Interval field, and then
click Set interval. To stop polling, click Stop.
View the Wireless Statistics Screen (UTM9S Only)
To view the Wireless Statistics screen:
1. Select Monitoring > System Status > Network Status. The Network Status screen
displays.
2. Click the Wireless Statistics option arrow in the upper right of the Network Status screen.
The Wireless Statistics screen displays:
Table 119. Router Statistics screen fields
Item Description
System up Time. The period since the last time that the UTM was started up.
Router Statistics
For each of the WAN interfaces, for the DSL interface (UTM9S only, not shown on the previous figure), and
for all LAN interfaces combined, the following statistics are displayed:
Tx Pkts The number of packets transmitted on the port in bytes.
Rx Pxts The number of packets received on the port in bytes.
Collisions The number of signal collisions that have occurred on the port. A collision occurs
when the port attempts to send data at the same time as a port on the other router or
computer that is connected to this port.
Tx B/s The number of bytes transmitted per second on the port.
Rx B/s The number of bytes received per second on the port.
Up Time The period that the port has been active since it was restarted.