5. Sensors and optical system ABL90 FLEX reference manual
5-42
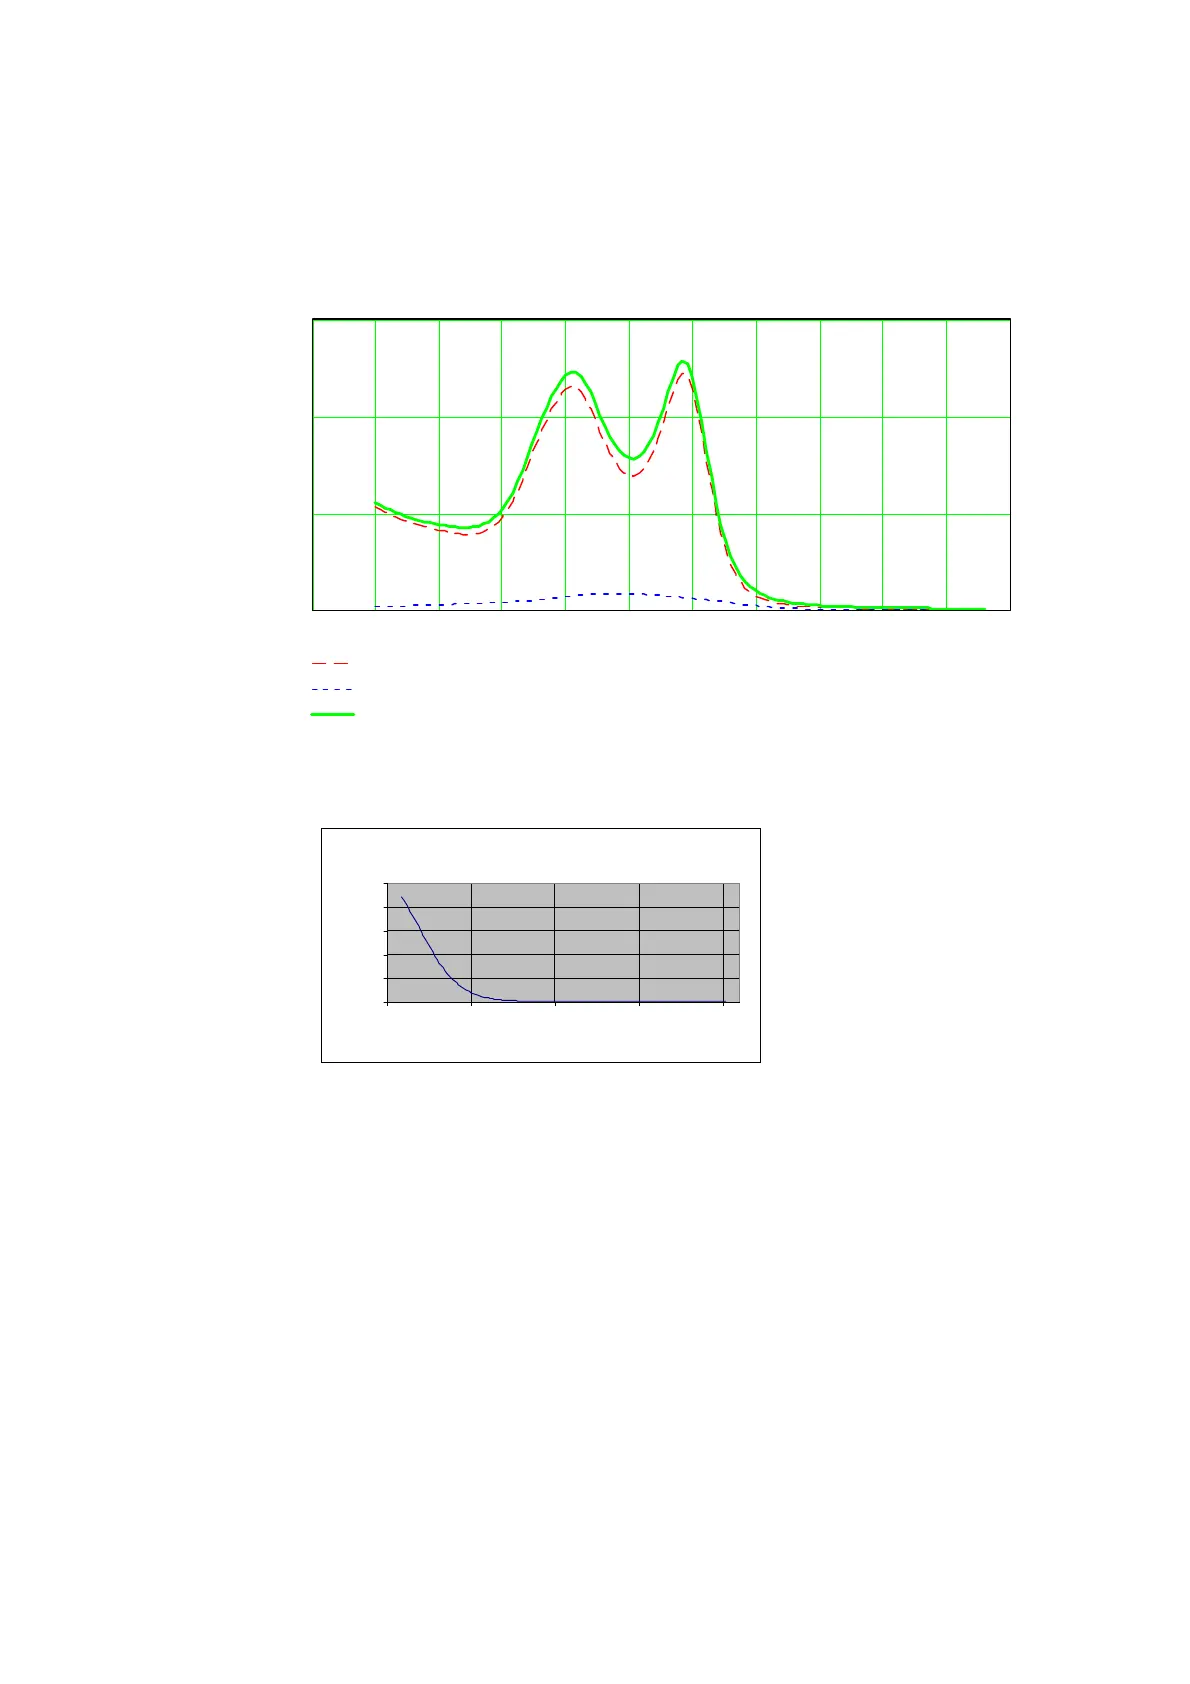
The figure below shows three spectra; pure O
2
Hb, pure HHb in a low
concentration, a spectrum of 92 % oxygenated hemoglobin obtained by adding
the spectra of O
2
Hb and HHb. The additivity of absorption and the continuity of
the spectra can be seen.
480 500 520 540 560 580 600 620 640 660 680
O
2
Hb (9.2 mmol/L)
HHb (0.8 mmol/L)
92 % oxygenated hemoglobin (i.e., 92 % O
2
Hb + 8 % HHb)
Wavelength/nm
Absorption
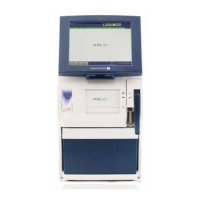
Example of the spectrum obtained from unconjugated bilirubin at a
concentration of 200 µmol/L.
The spectrum of conjugated bilirubin is slightly different.
In the spectrum taken of a sample, the absorption recorded at each wavelength
contains contributions from each of the compounds in the sample. The task then
is to determine the magnitude of that contribution and thereby the
concentration of each compound in the sample.
The concentrations are determined using the following equation:
138
y
total
1
K
n
n
y
n
cA
where:
n
y
K
=
a constant specific to compound y at wavelength
n
.
Spectrum
examples
200umol/L Unconjugated Bilirubin in Plasma
0
0.02
0.04
0.06
0.08
0.1
470 520 570 620 670
nm
Absorbance
Determining
concentrations