7. Performance characteristics ABL90 FLEX reference manual
7-26
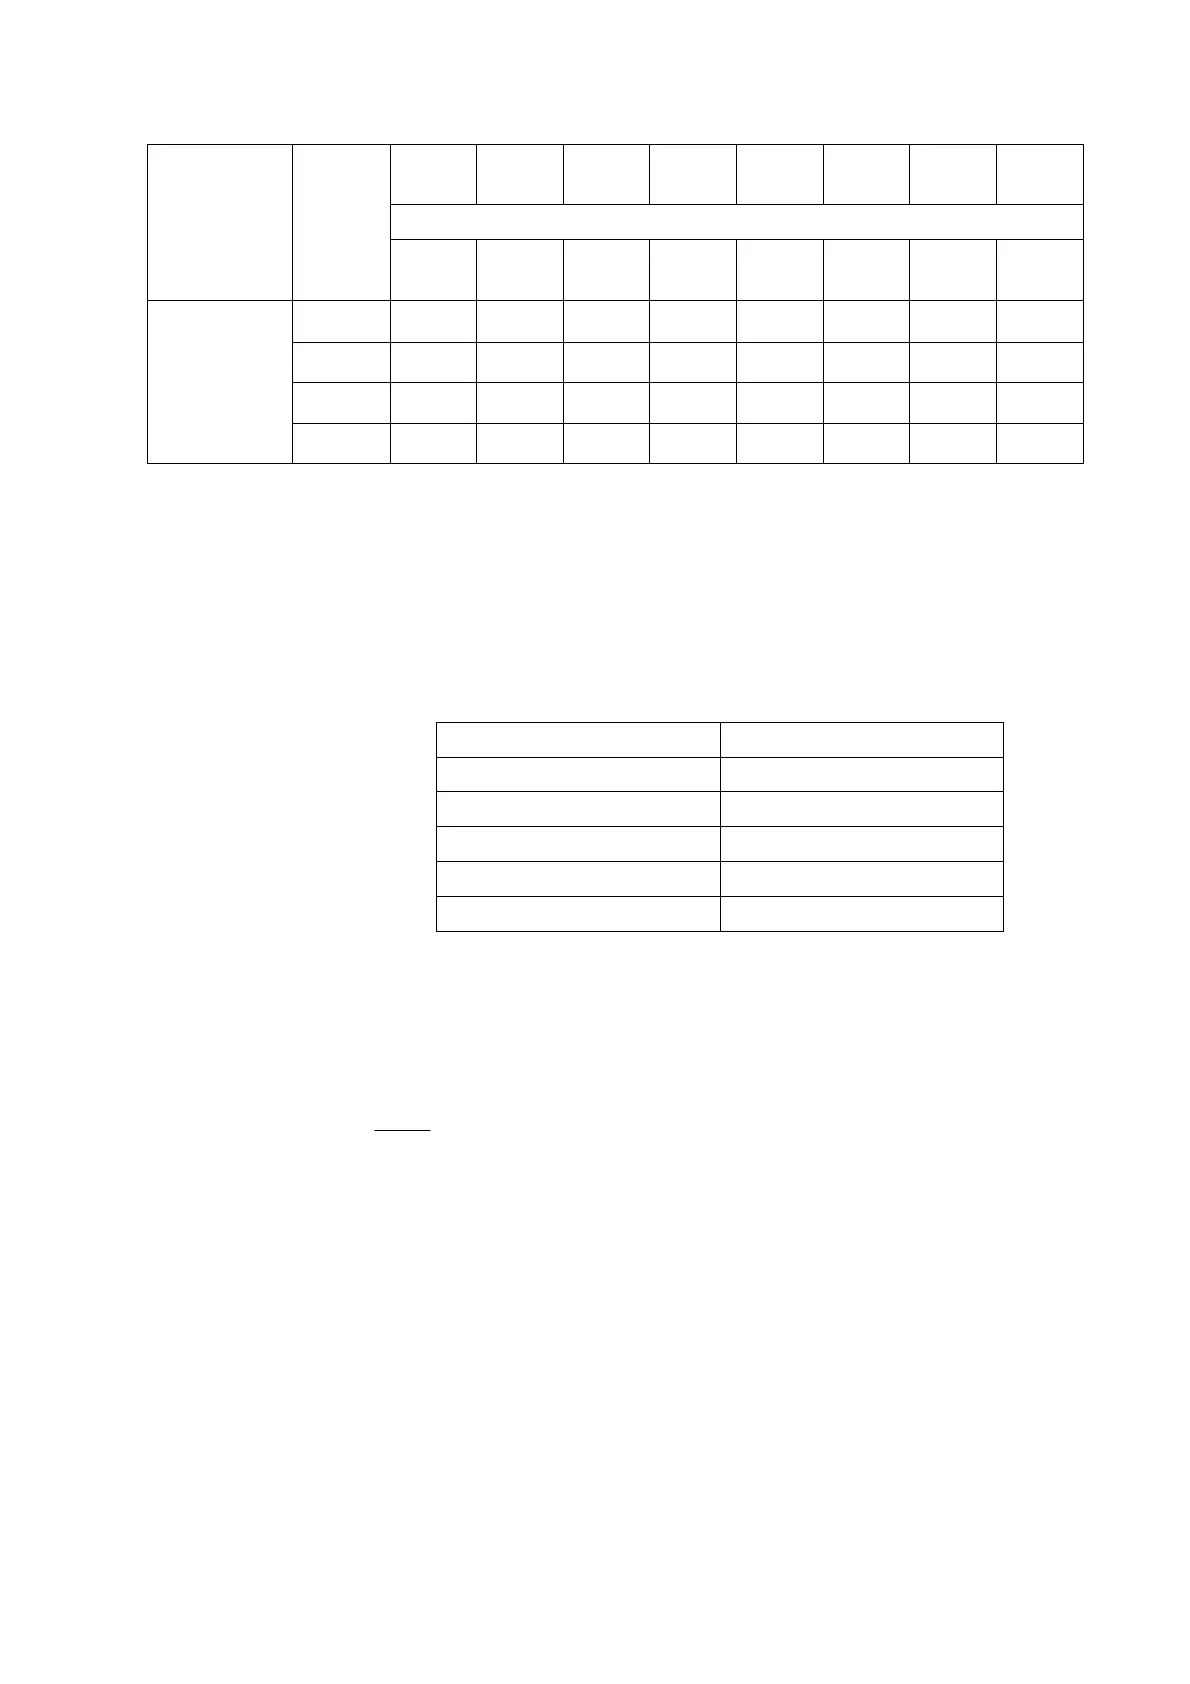
ctHb
g/dL
sO
2
%
FO
2
Hb
%
FCOHb
%
FMetHb
%
FHHb
%
FHbF
%
ctBil
µmol/L
Limit for clinical relevance…..
Level
0.5 g/dL 1% 1% 1% 1% 1% 20%
30
µmol/L
2 g/L
2.29 -4.12 -16.23 2.85 9.87 3.52 ND
<|30|
0.8 g/L 1.15 -2.02 -8.68 1.53 5.33 1.82 ND <|30|
0.4 g/L 0.69 -1.27 -5.23 <|1%| 3.18 1.17 ND <|30|
Cyanocobalamin
0.2 g/L <|0.5| <|1%| -2.23 <|1%| 1.35 <|1%| ND <|30|
* Interference calculated from spectrum
** ND: Not displayed
FHbF is sensitive to pH deviations from the nominal value of pH = 7.4. If pH is
converted into
cH
+
(hydrogen ion concentration), the relationship between the changes
in
cH
+
and FHbF is linear as seen from the following equation:
+
HbF 0.51%/(nmol/L) ( H 40 nmol/L)Fc
pH
FHbF %
7.15 -15.8
7.25 -8.2
7.4 0
7.5 4.1
7.6 7.7
MCHC (Mean Corpuscular Hemoglobin Concentration) is used to estimate hematocrit,
Hct, which is used in the
ctBil measurement. MCHC is an average Hb concentration in
the red blood cell (RBC). If the RBC volume decreases, MCHC increases. If an RBC has
iron deficit, MCHC decreases.
Hct is determined from
ctHb as follows:
tHb
Hct
MCHC
c
A standard value of 332 g/L is assumed for MCHC which gives
Hct =
ctHb 0.0301 if the unit for ctHb is g/dL.
MCHC can, however, deviate from this standard value as illustrated in the following
table (see the next page).
Erythrocytometric values given for “apparently healthy” white and black subjects of
different ages are taken from: “Geigy Scientific Tables, Physical Chemistry, Composition
of Blood, Hematology, Somametric Data”, CIBA-GEIGY, 1984; 3, 207.
FHbF
sensitivity for
pH changes
ctBil sensitivity
for MCHC
variations