Uni-Probe LB 490
BERTHOLD TECHNOLOGIES GmbH & Co. KG
3 – 323
Volume 3 Menu Structure
3
2.25 1-2 POINT CURVE
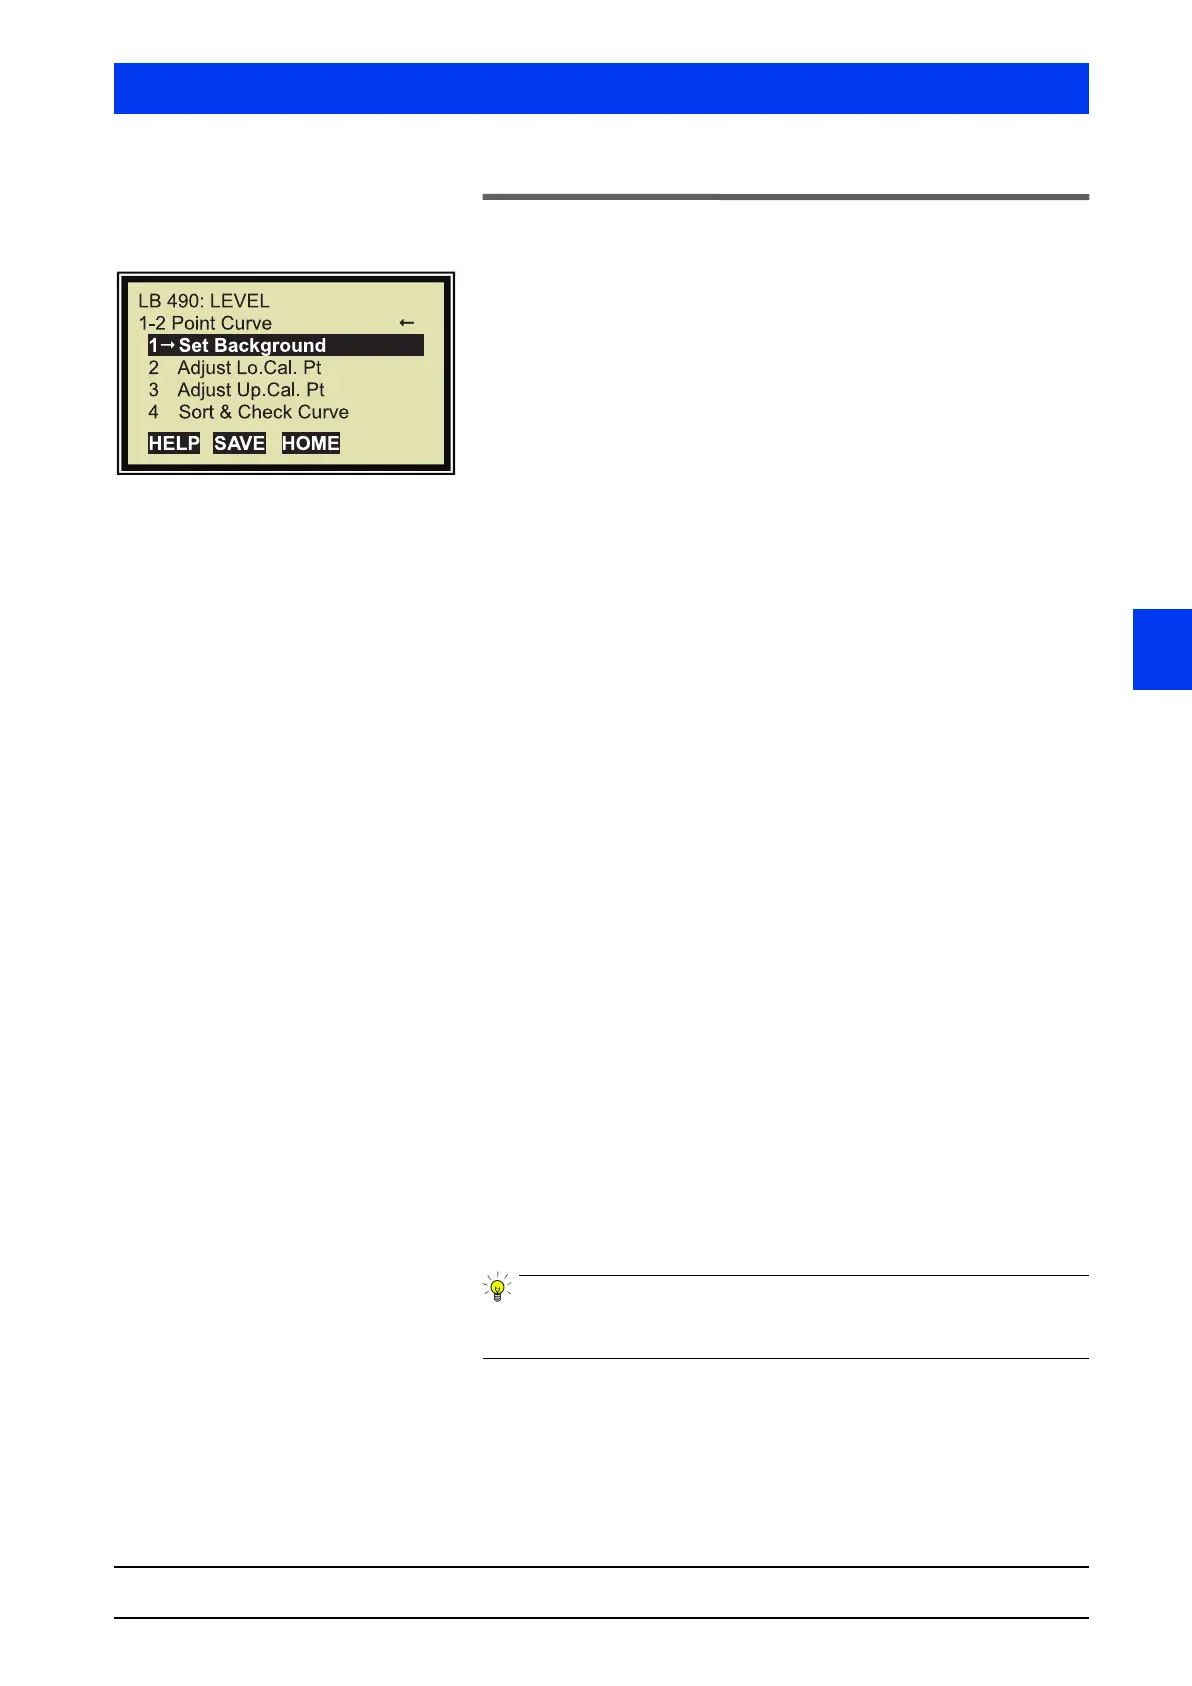
If you have entered 1 or 2 calibration points in the previous window
Calibration, the window depicted to the left will appear.
1 SET BACKGROUND
Determine the background rate (see also Volume 3, section 4.1).
2 ADJUST LO. CAL. PT
Set the lower calibration point.
Define the level and the count rate for the lower calibration point.
Typically, the lower calibration point is at 0% level.
3 ADJUST UP. CAL. PT
Set the upper calibration point.
Define the level and the count rate for the upper calibration point.
Typically, the upper calibration point is at 100% level.
In another query you have to choose between a linear or exponen-
tial calibration curve. Standard setting is linear.
One-Point Calibration For one-point calibration, the count rate for the upper calibration
point is not read-in but calculated using the tank data. You have to
enter the following data:
• Product density:
Density of the product in (g/cm
3
), the level of which is to be
measured.
• Absorption path:
Path of radiation (in mm) in the product to be measured. Typi-
cally, the internal diameter of the tank (see also Volume 3, sec-
tion 4).
4 SORT & CHECK CURVE
Check the calibration curve. The following items are checked:
• Monotony?
rising level – falling count rate
• Full count rate higher than background?
Always select this function at the end of the calibration process to
ensure that your calibration data is plausible.
The calibration sequence is described in detail in Volume 3, section
4.


 To Next Page