IMS.OM.002949.DRM Page 254 of 310 Version 1.4
Doremi Labs
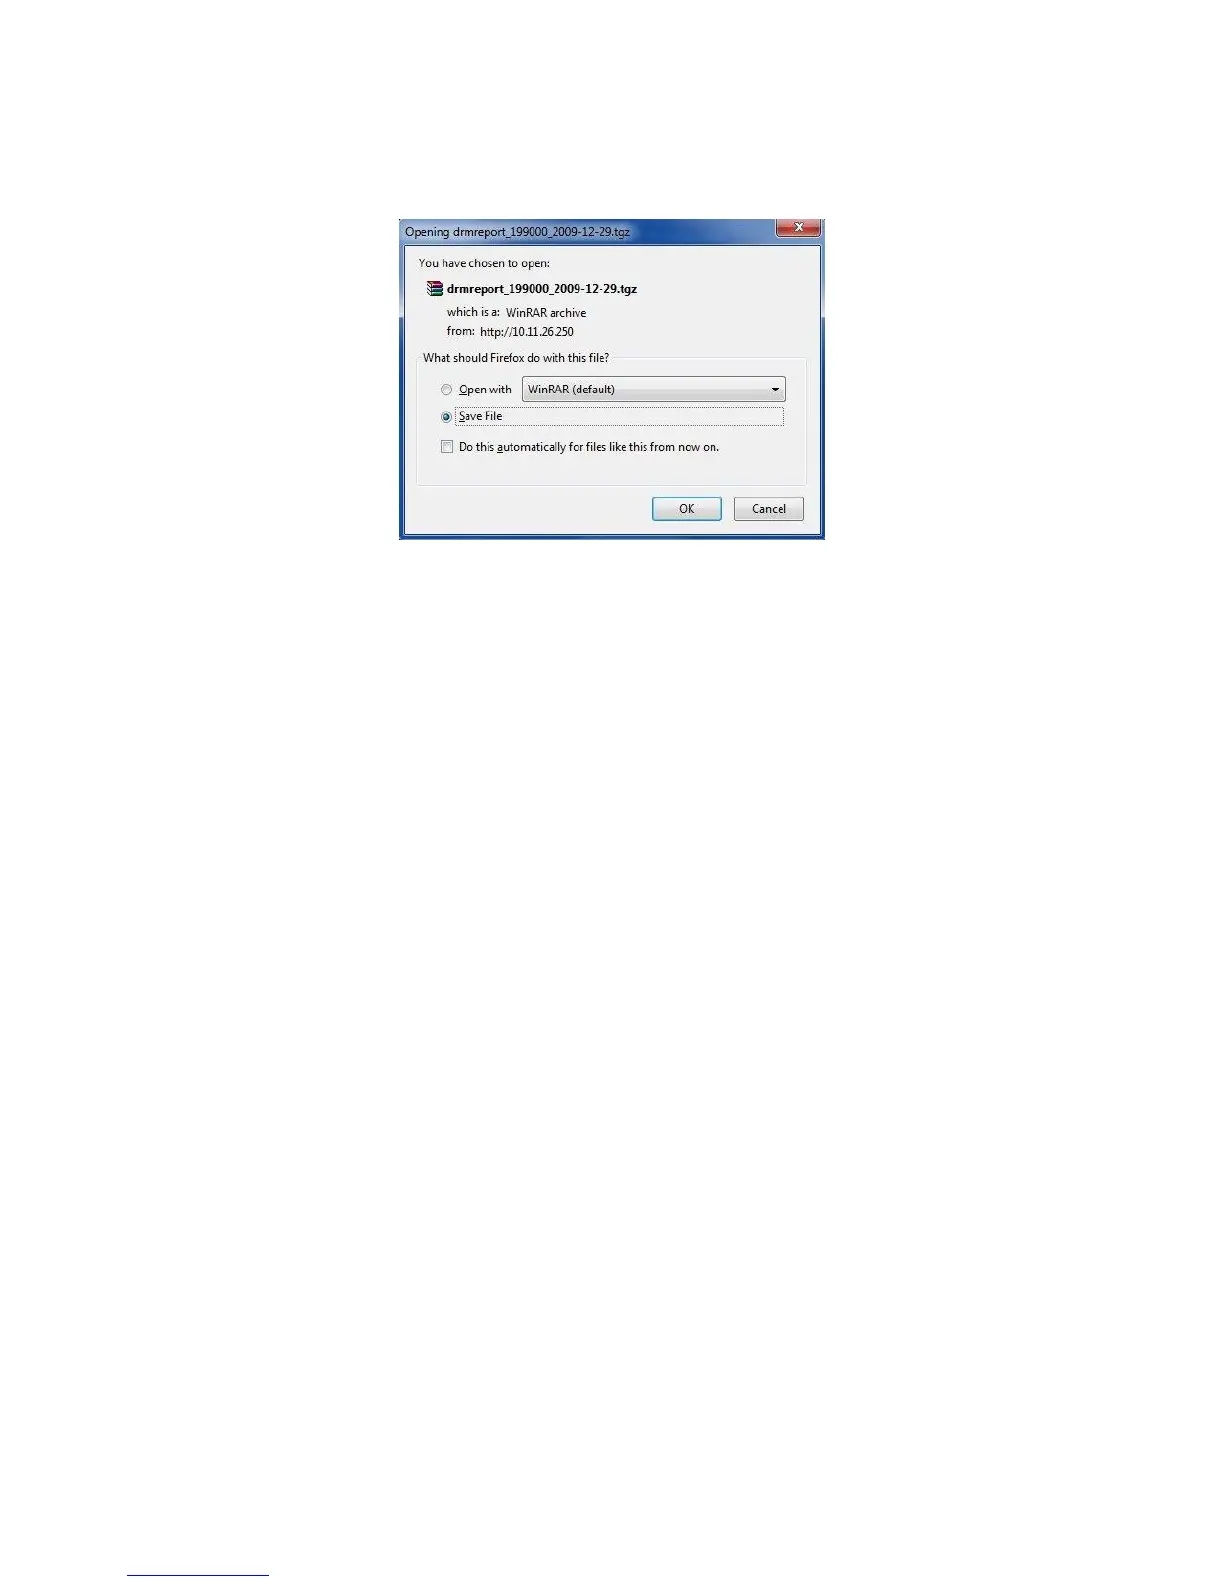
When the generation is complete, a window will appear asking the user if they would like
to open or save the report (Figure 316). Make your selection and click Ok. The report is
saved on the computer’s default downloads folder.
Figure 316: Detailed Report
14.3 Status Overview Tab
The Status Overview tab provides the following information concerning the server itself: Fans,
Temperature, Voltage, Memory, Network, Projector, Storage, Security Manager, Time,
Administration, Playback, Security, and Features (Figure 317).
To access the Status Overview Tab, click on the green arrow on the right hand side of the GUI
in the Storage and System tabs (Figure 332).
Clicking on a section on the left side of the GUI will take you from the top of the page to that
section for more detailed information.
The colored icons next to the sections reveal the status of that section. Green is healthy, orange
is a warning, and red is a failure (Figure 317).