Model 831 Manual Performing the Measurement 7-7
Data Display
See “Overall Tab” on page 5-12. The measured data are available for display from the Overall
View. These data are distributed over thirteen sections (with
the 831-IH and 831-OB3 options). Use the 8
and 2
keys to change sections. The first two sections from the top
present basic sound level parameters as shown in FIGURE
7-5 and FIGURE 7-6.
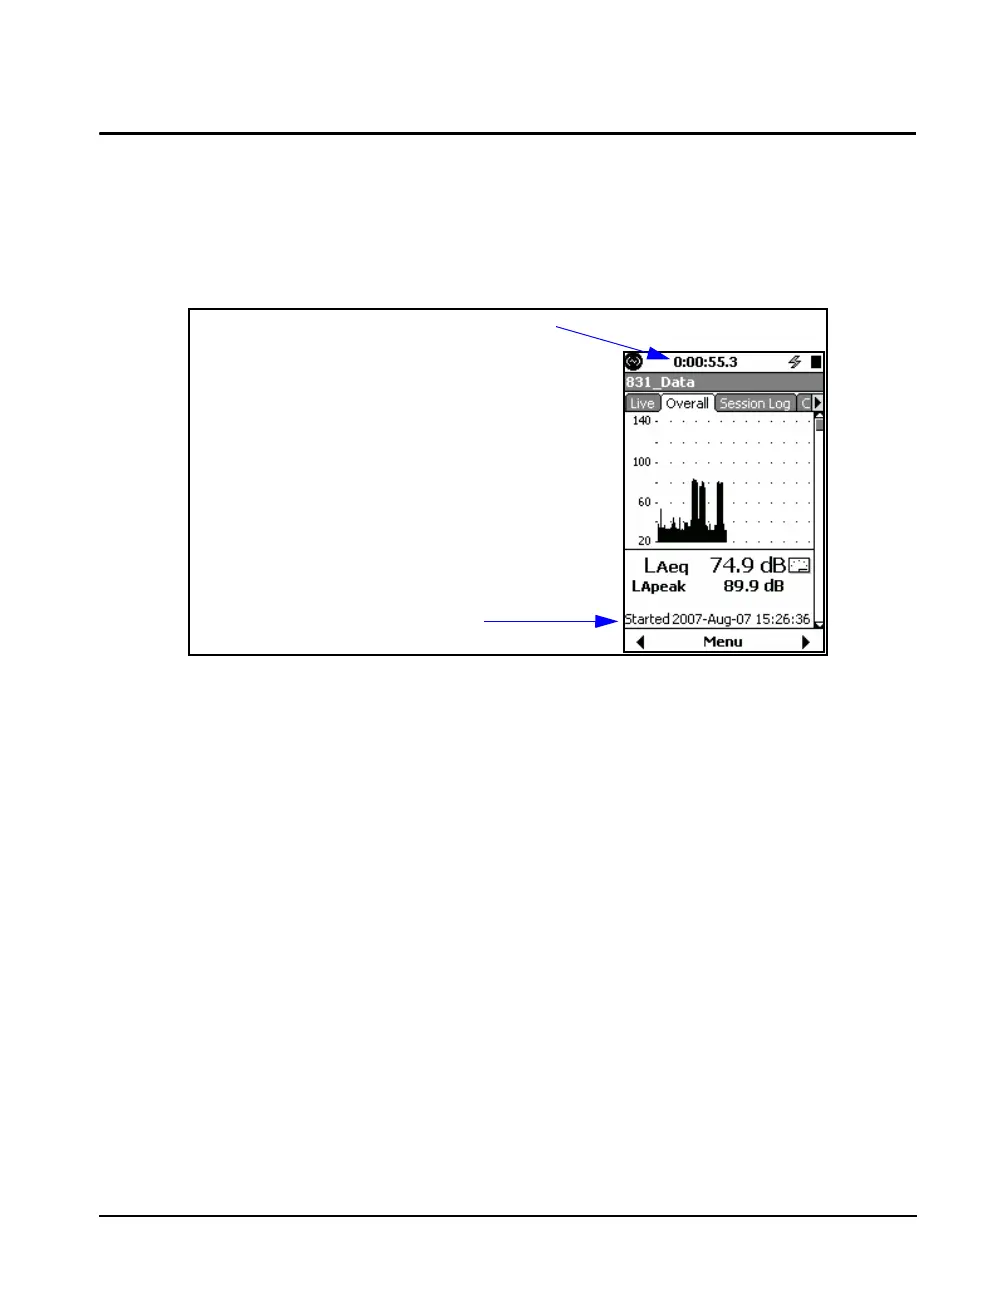
FIGURE 7-5 Leq and Running SPL
The two digital displays present the frequency weighted Leq
value (L
Aeq
= 74.9 dB) and the frequency weighted Lpeak
value (L
Apeak
= 89.9 dB). Both of these were measured
using A-weighting as indicated by the A. The duration of the
measurement is indicated at the top of the display and the
data and time that the measurement was initiated are
indicated at the bottom of the display. The graph represents
the profile of the Leq as a function of time during the entire
measurement period.
Measurement Duration
Date and Time of Initiation
of Measurement